
The Measurement Problem: Why There Is Still No Standard Way to Measure AI Search Visibility

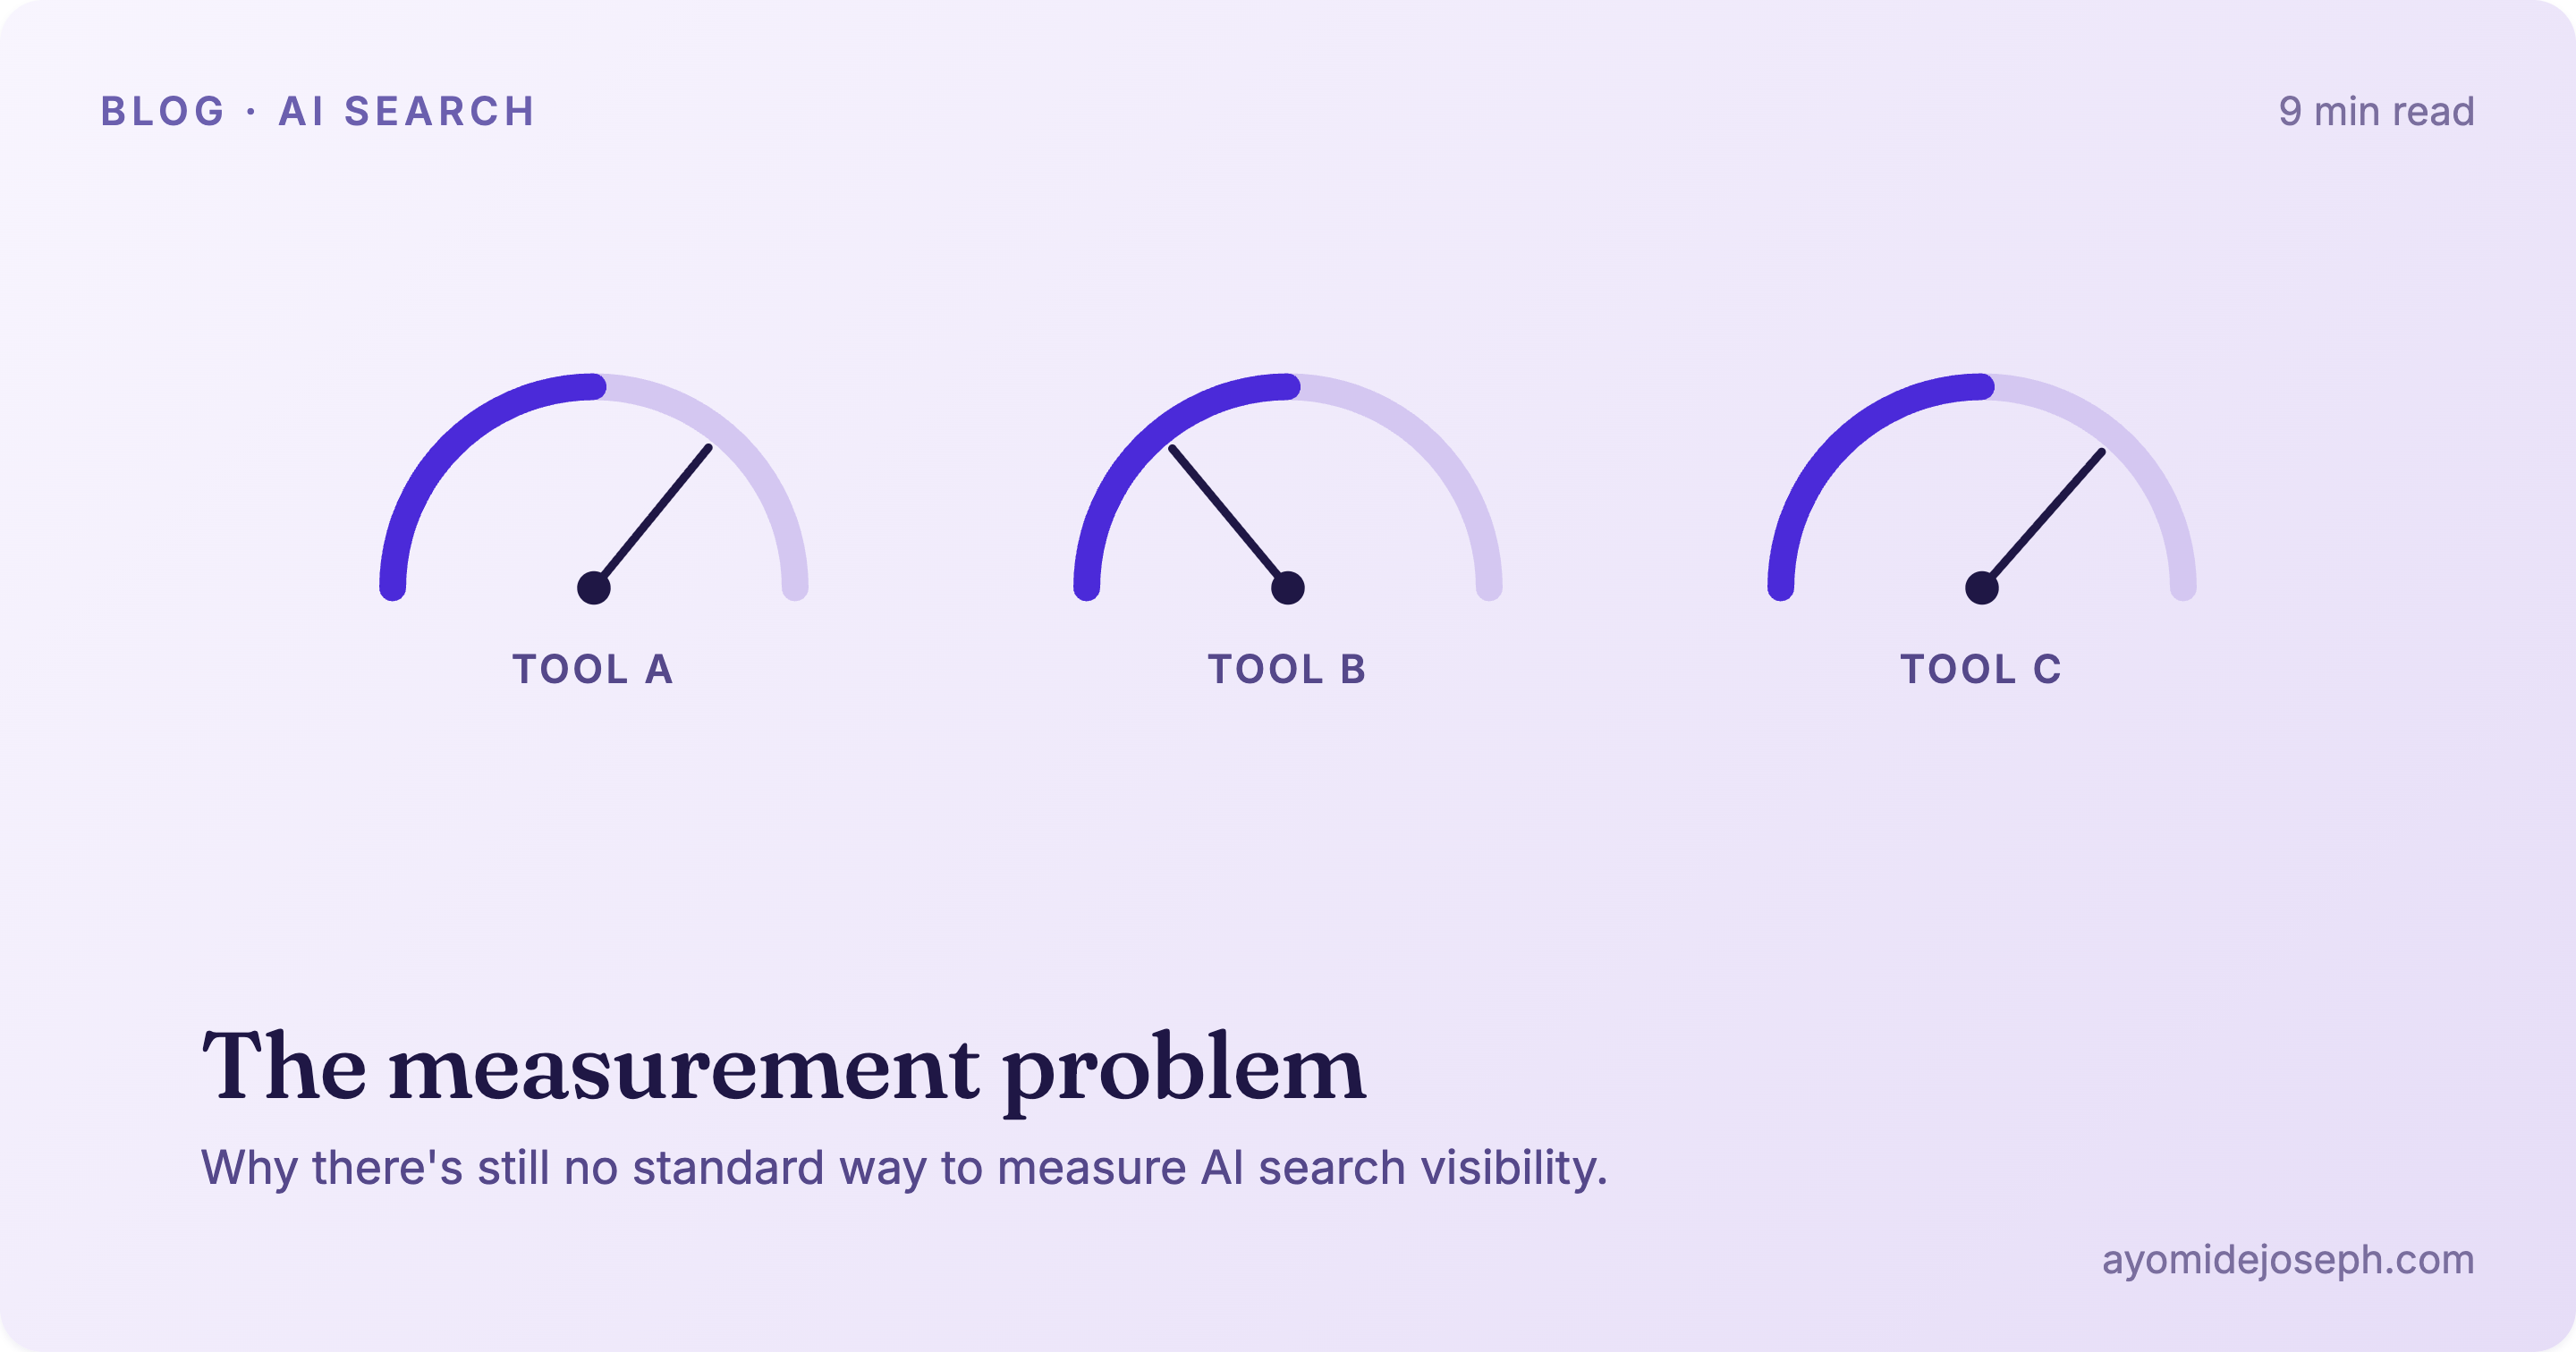
The reason nobody agrees on how to measure AI search visibility is that the thing being measured produces no official record, generates different answers to the same question, cites different sources every few weeks, and gets described by six different metrics that do not mean the same thing.
A marketing leader who wants to know whether her brand appears in AI search can buy three tools, point them at the same category, and receive three different answers.
- One might report a 12% share of voice.
- Another might put it at 20%.
- A third might show the score moving five percentage points between Tuesday and Thursday, even though her content, competitors, and broader strategy have not visibly changed.
None is necessarily wrong. They may be tracking different prompts, models, locations, competitors, mentions, citations, or positions. They may also be calculating their final scores using entirely different formulas.
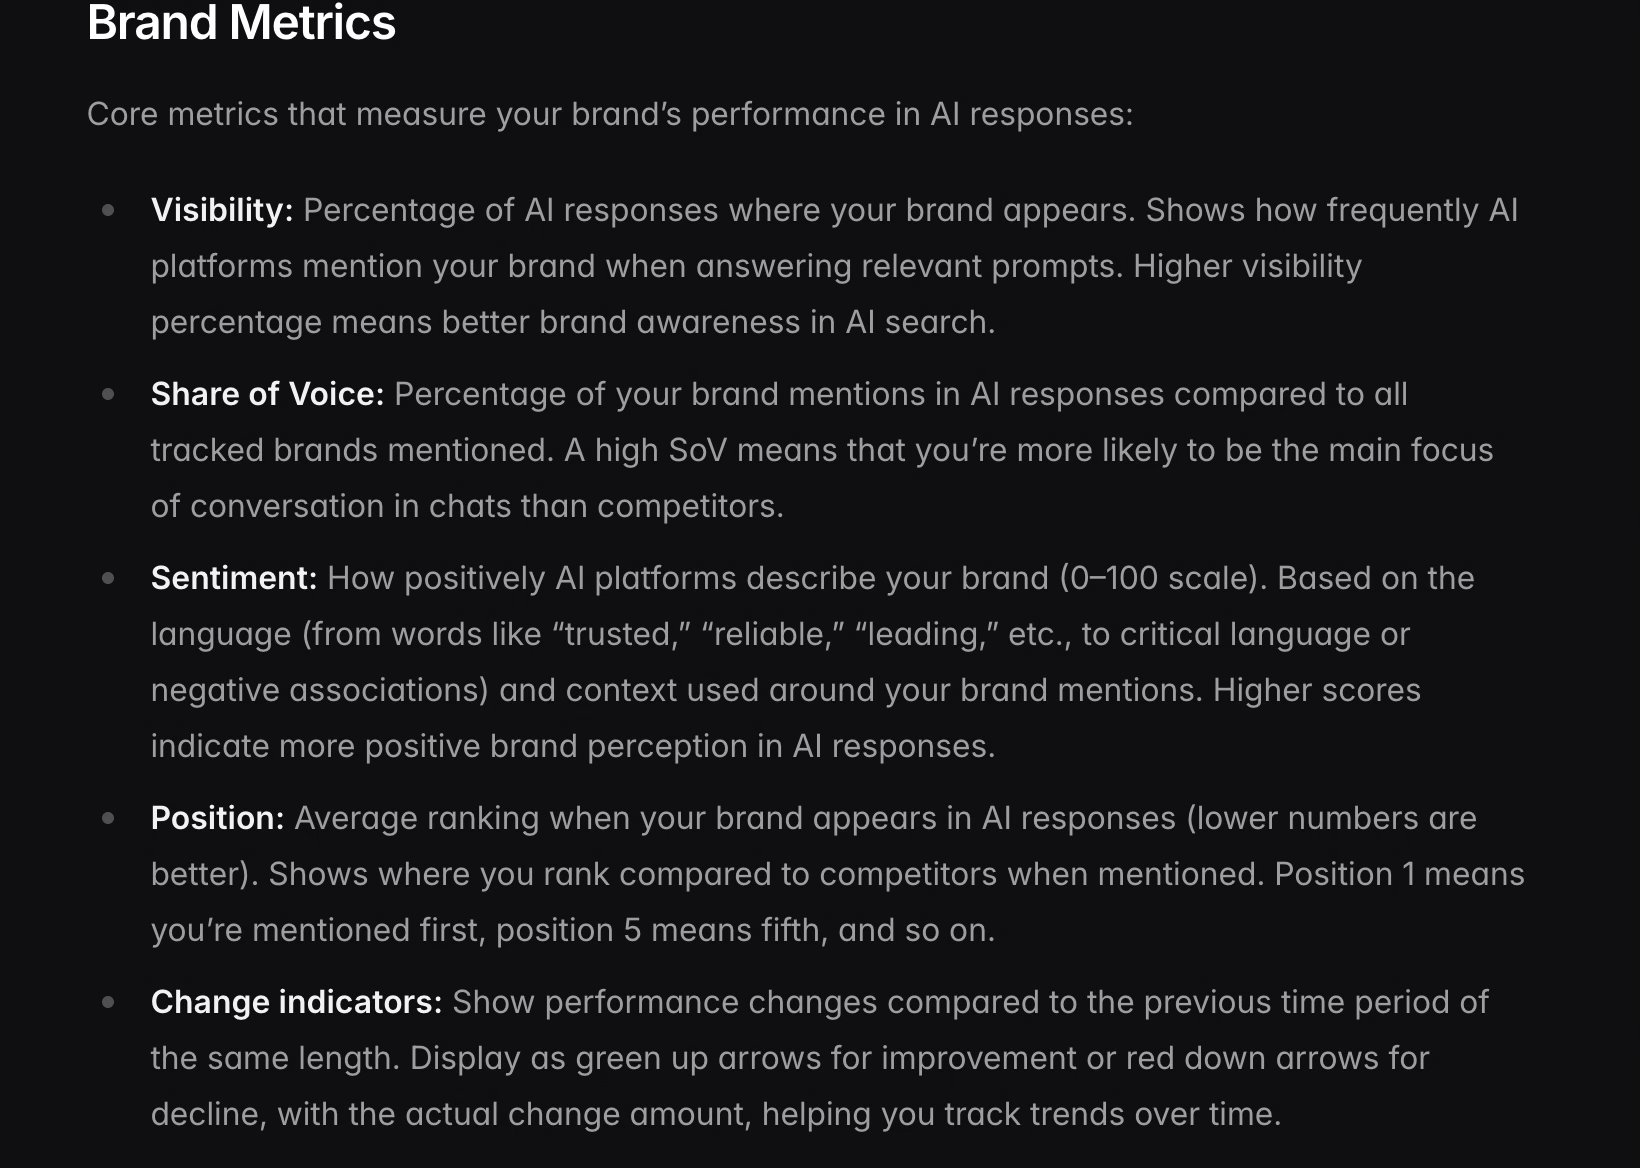
For context, Peec calculates visibility as the percentage of responses mentioning a brand and share of voice as the brand’s portion of all tracked brand mentions.
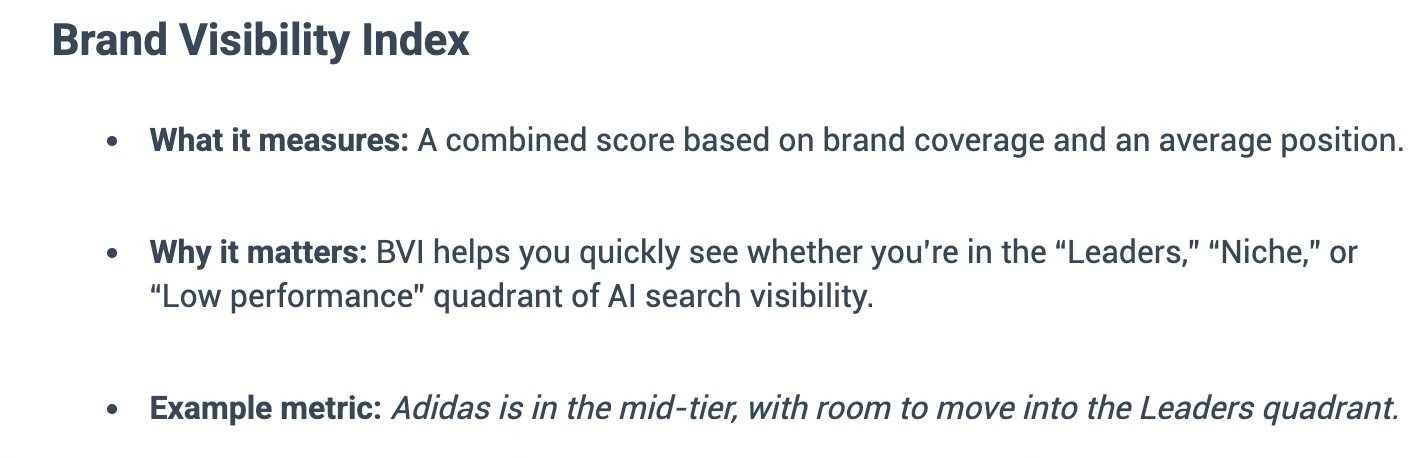
Otterly separates share of voice, brand position, domain coverage, citations, and a combined Brand Visibility Index.
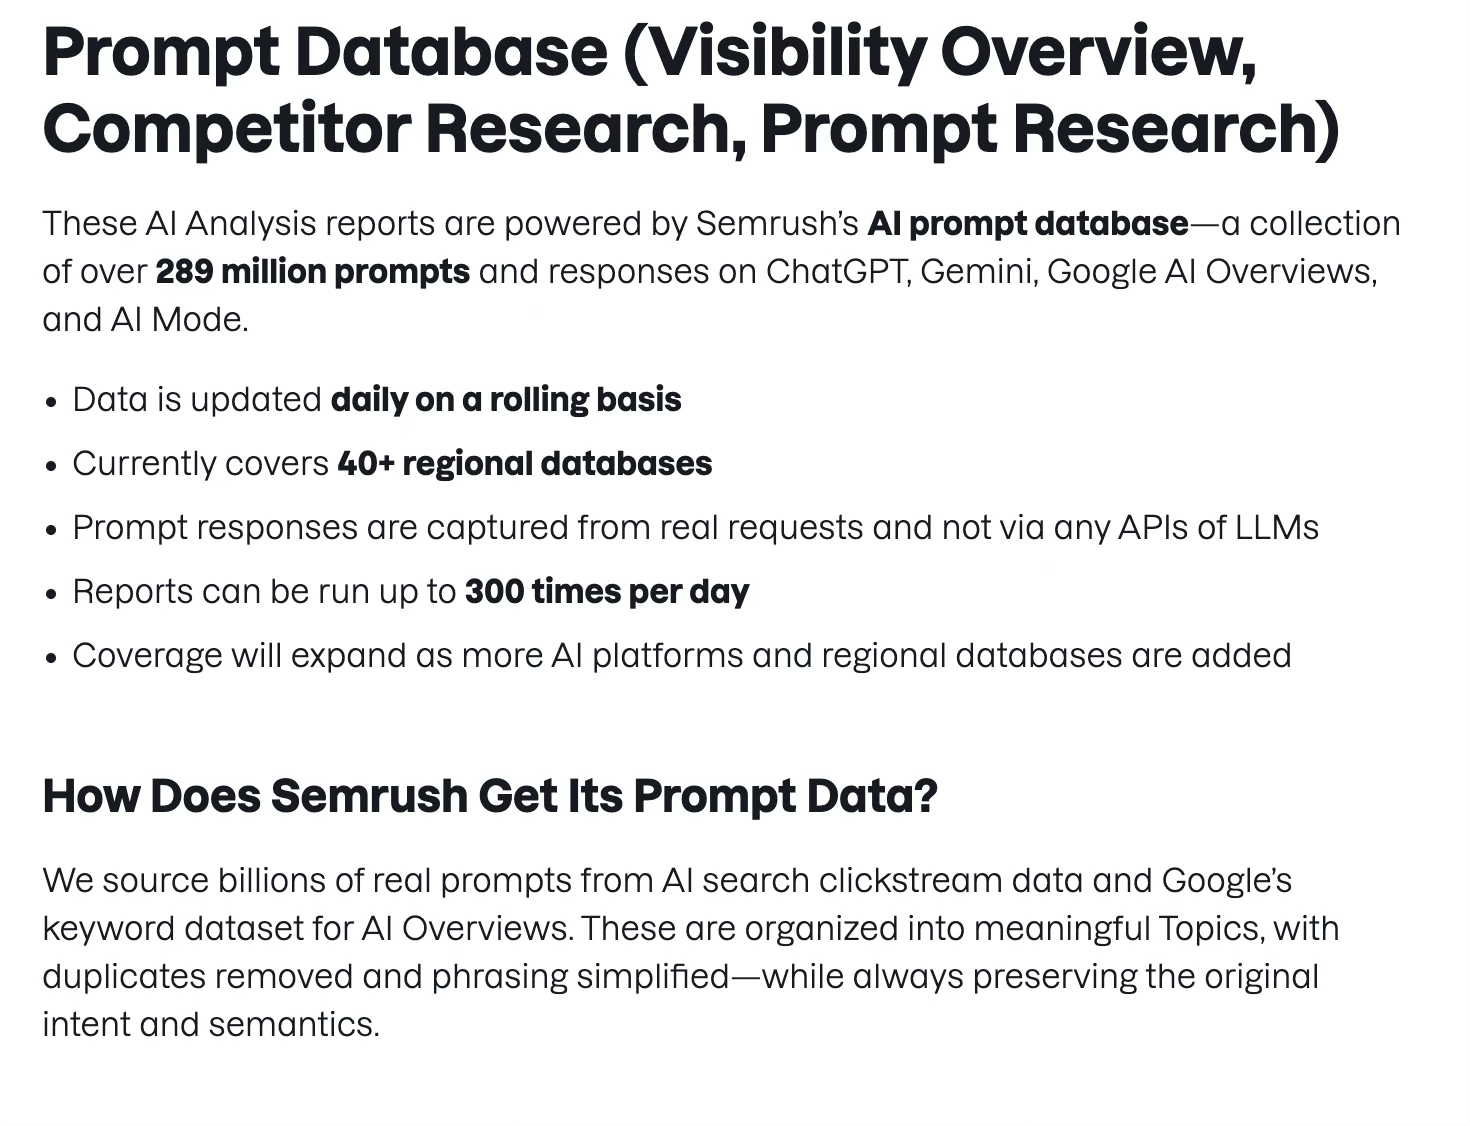
Semrush uses its own query database, brand-extraction system, update cadence, models, locations, and custom prompt tracking.
Then there is the underlying volatility of AI search itself. The same model can answer the same question differently across repeated runs, changing which brands it mentions and which sources it cites without any corresponding change to the content being measured.
Or as Josh Blyskal & Sartaj Rajpal of Profound puts it when explaining AI search volatility:
“AI search engines like ChatGPT and Google AI Overviews don't give you the same answer twice. That’s because they’re built to be probabilistic rather than deterministic. When you ask a question, these models predict what comes next while throwing in controlled randomness to keep responses from becoming repetitive or predictable.”
That is the state of AI search visibility measurement in 2026. It’s different tools measuring different signals across systems that do not produce stable results.
The more concerning problem is that marketing teams are beginning to use these directional metrics to make increasingly significant decisions about content, budgets, competitive positioning, and where to invest next.
There Is No Ground Truth to Measure Against
Traditional SEO had a reference system that the industry could inspect. When Google ranks a page, you could look at a search result, see position four, and know that position four was a fact about the world that other people would also observe.
Search Console then supplied first-party data from Google itself, including impressions, clicks, click-through rate, average position, and the queries and pages associated with that activity.
The data was aggregated and subject to reporting limitations, but marketers had a platform-owned record against which third-party tools could be checked.
AI search has no equivalent.
ChatGPT, Perplexity, Gemini, and Google’s AI Mode do not publish rankings. There is no position four.
There is a synthesized answer that may name your brand, cite your page, describe you accurately or badly, and change the next time someone asks.
Because no engine hands out this data, every measurement tool has to manufacture its own by running prompts against these systems and recording what comes back.
Metehan Yeşilyurt, GEO researcher at Peec AI confirms this as he explains that every AI visibility platform is solving the same underlying problem: there is no Search Console for AI answers, so tools generate the data themselves. How they generate it is the single biggest reason two tools disagree.
When the thing you are measuring produces no official record, measurement becomes an act of reconstruction, and reconstruction involves choices. Those choices fork in at least four places, and each fork moves the number.
The First Fork: How the Question Gets Asked
The most consequential choice a tool makes is whether to query the AI through its developer API or to scrape the actual user interface.
- An API-based tool sends your tracked prompts to the model provider’s developer endpoint, the same way a software engineer would, and parses the response.
- A UI-scraping tool drives the real consumer interface, the version your buyer actually sees, and reads what appears on the screen.
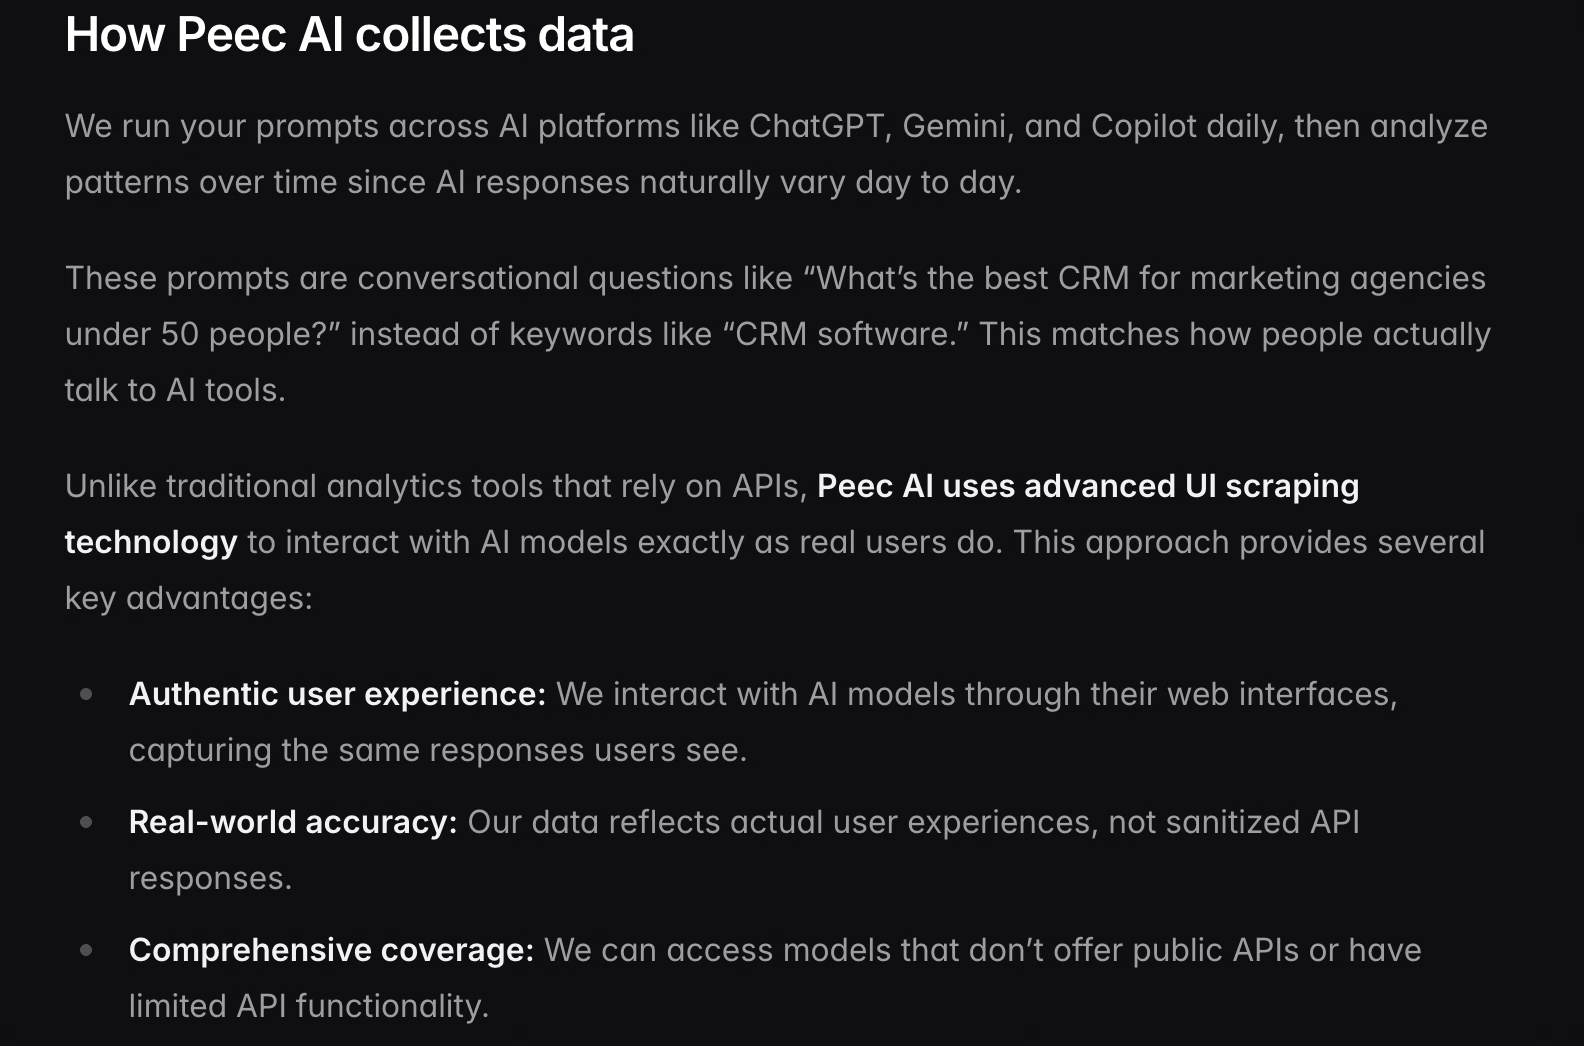
Peec AI, one of the more popular mid-market platforms, built its product on UI scraping specifically so that what it records matches what a human user encounters, including the contextual framing and competitor associations that a bare API call can miss.
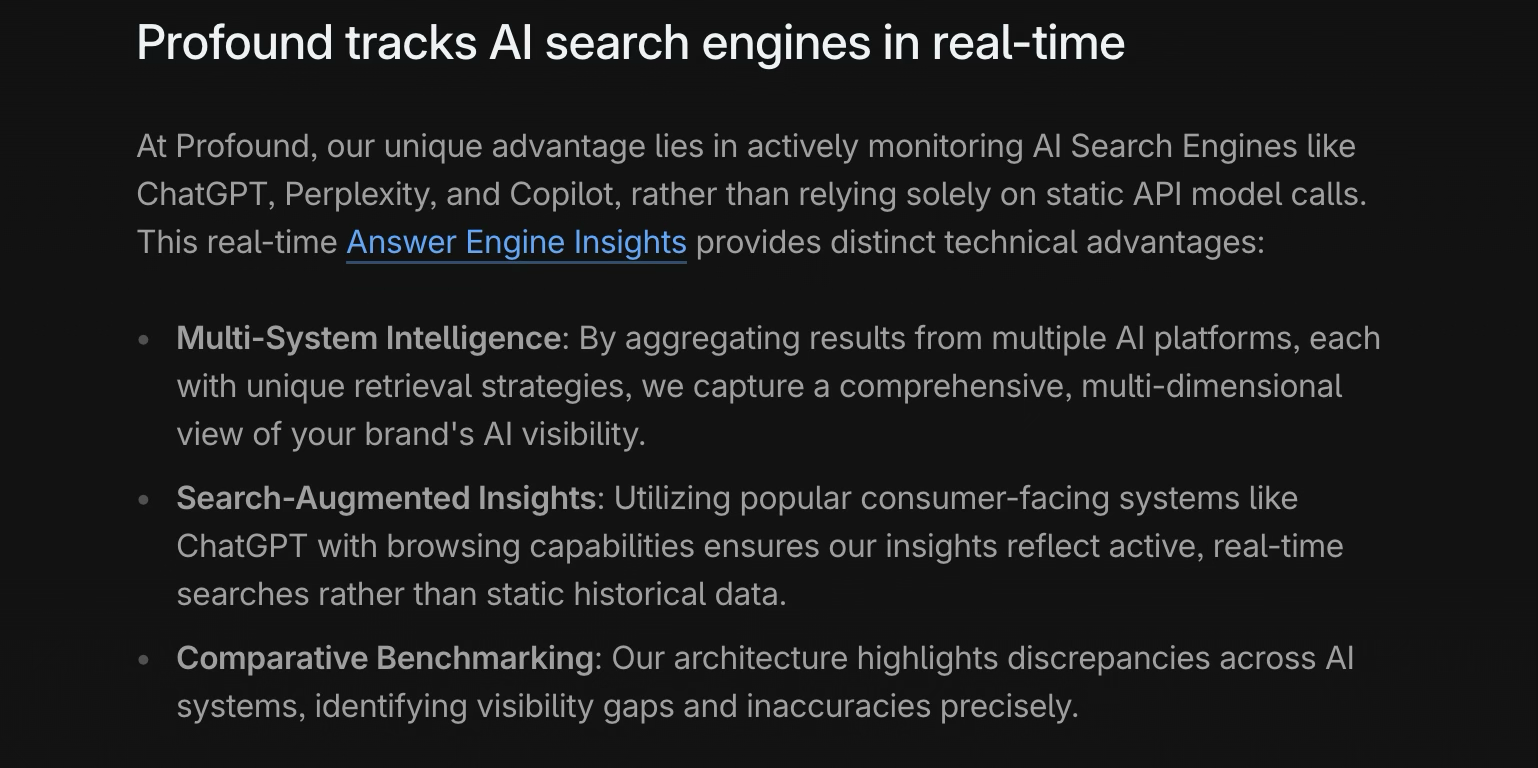
Profound, the enterprise leader in the category, runs prompts at large scale through the consumer-facing interfaces of major answer engines. Then it combines that response data with separate server- and CDN-level insights into AI crawler behaviour.
The methodologies of both tools impact the results you get.
To test this out, Jakub Sadowski & Michał Suski of Surfer ran the same prompt set through ChatGPT and Perplexity’s interface and through its API.
They found the responses diverged by up to a quarter, concluding bluntly that using API responses as a proxy for real visibility gives you the wrong picture.
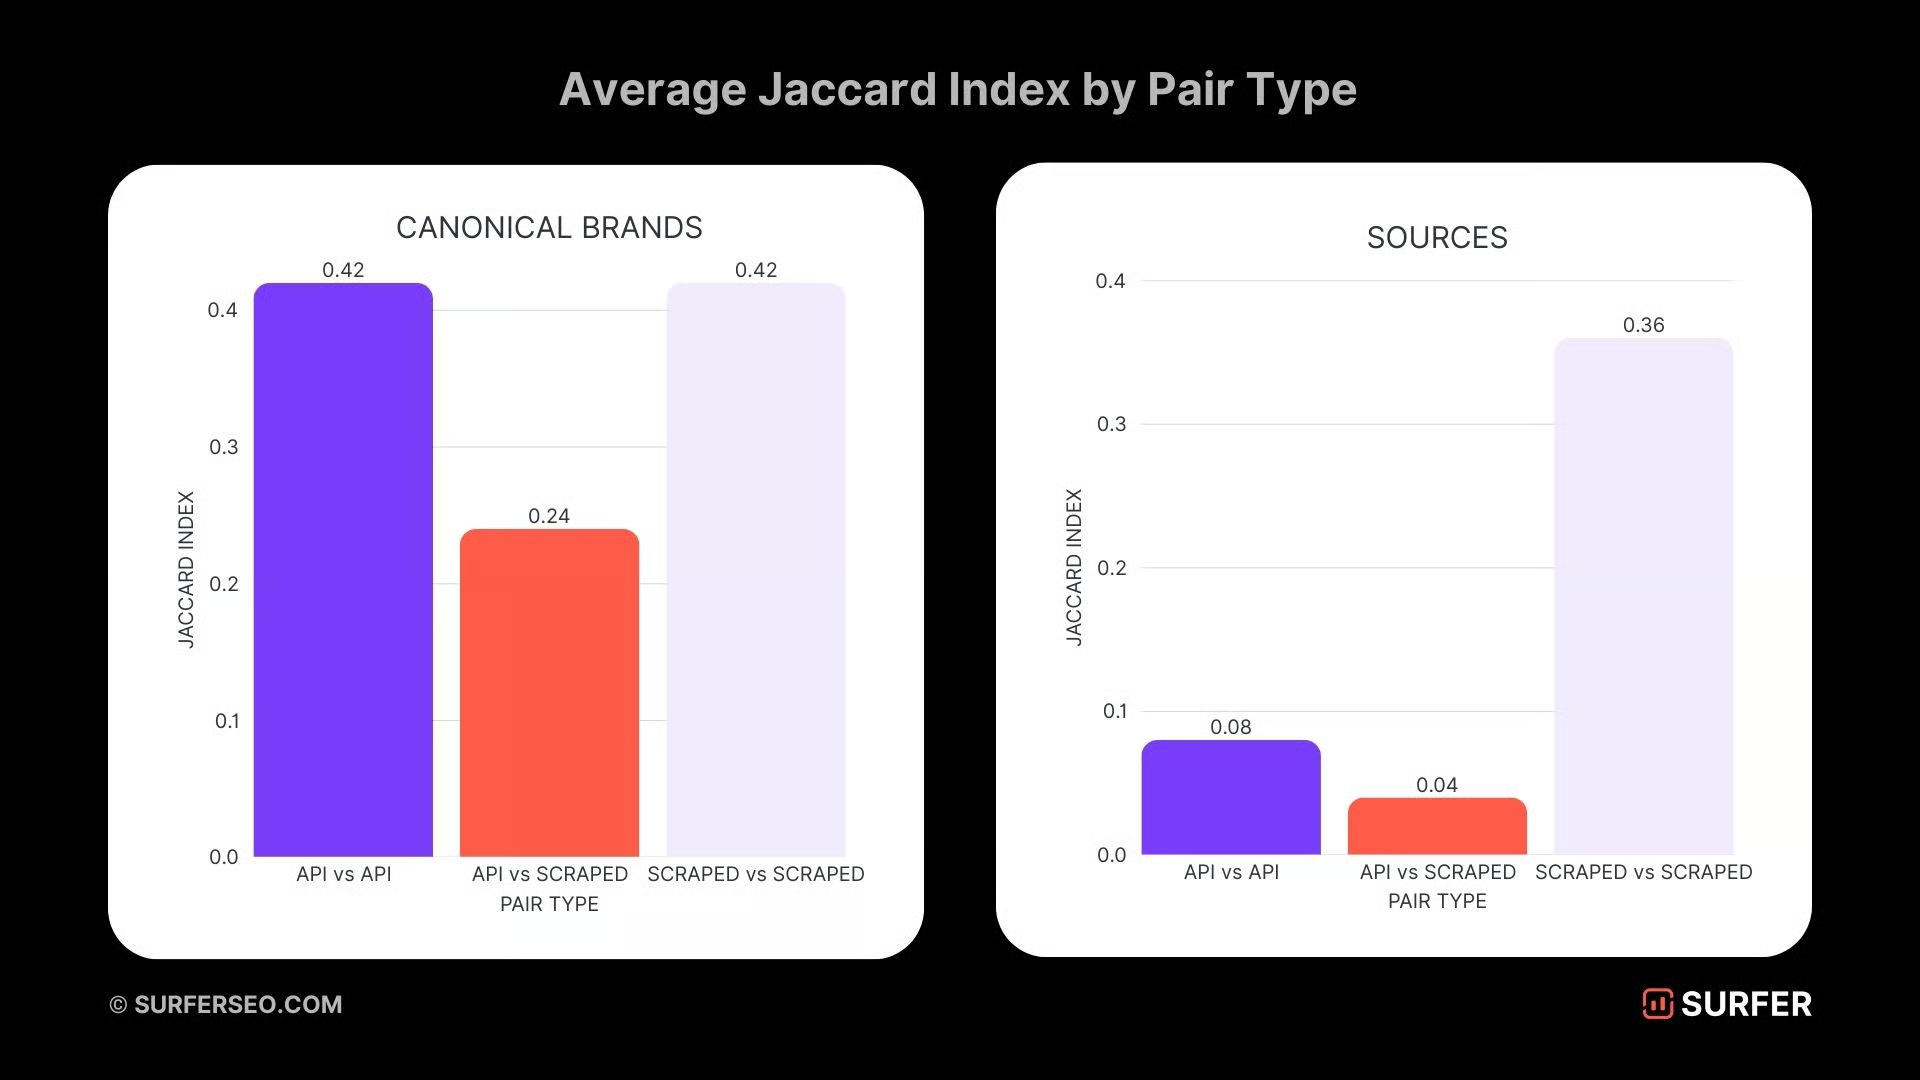
Let’s look at Surfer’s numbers: API answers ran shorter, around 332 words on average against 433 for scraped answers, and returned roughly seven sources where the scraped interface consistently surfaced ten.
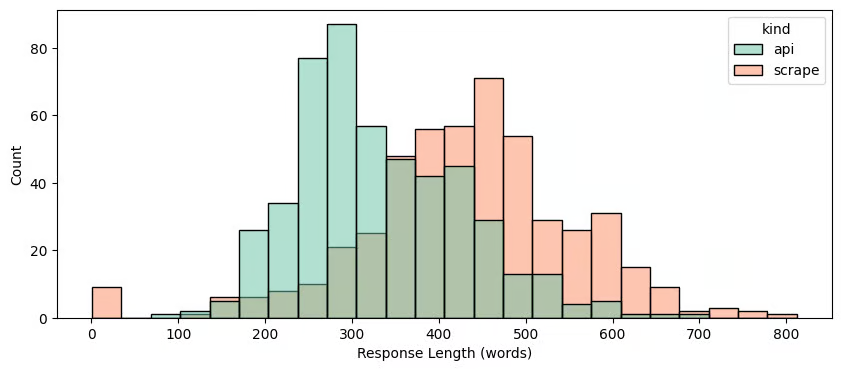
A tool that queries the API is looking at a different, thinner surface than the one your customer is looking at.
The vendors, predictably, disagree about which method is correct, and the disagreement tends to track which method each one uses.
Conductor’s Chief Product Officer, Wei Zheng has pushed back hard on the idea that UI scraping (crawling the LLMs) is the only path to accuracy. She argues that every major model now supports grounded search through its API and that scraping brings fragility, compliance exposure, and maintenance cost.
Meanwhile, Kimmo Ihanus, Co-Founder & CTO of Superlines, argues the opposite case. He notes that API responses strip out the formatting and presentation hierarchy that determine whether a user actually notices a brand mention in the first place, and that a source cited without the brand being named at all is something only interface-level analysis can catch.
The Second Fork: The Answer Changes Every Time You Ask
Suppose two tools somehow agreed on a method. They would still disagree, because the models themselves do not return the same answer twice.
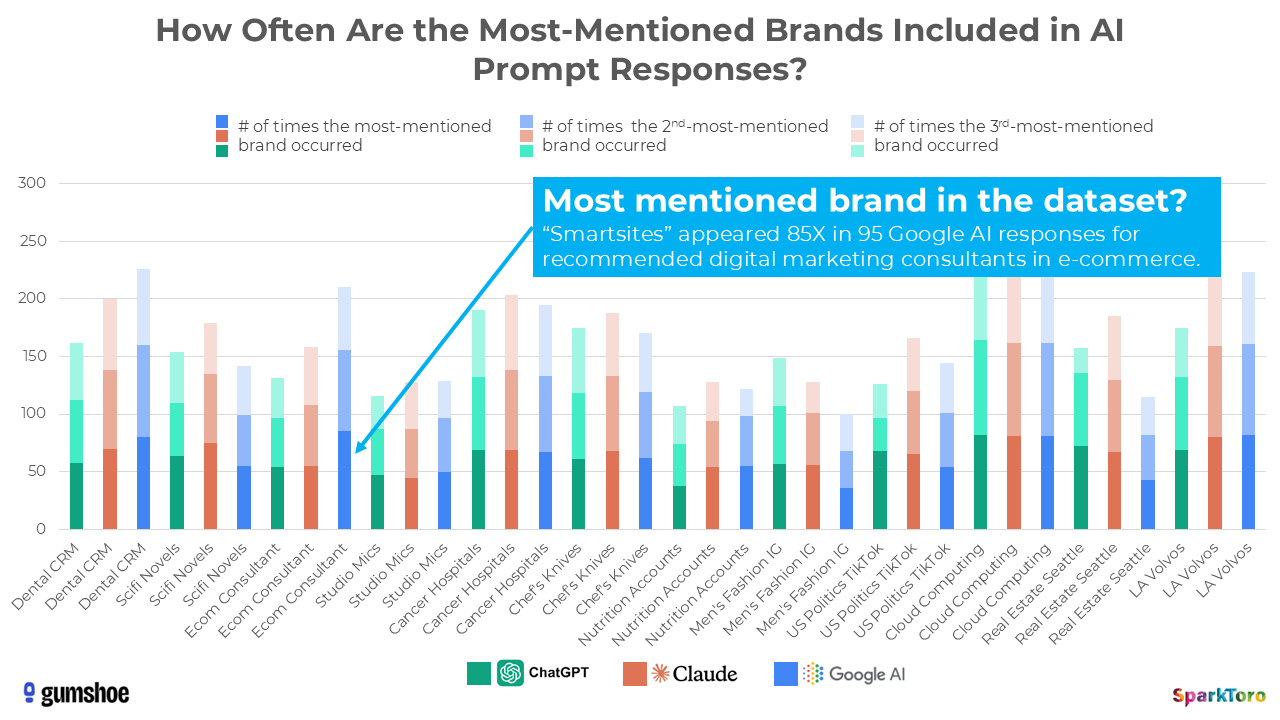
Run an identical prompt against a model a thousand times, holding every setting constant, and you will not get a thousand identical responses. You will get dozens to hundreds of variants.
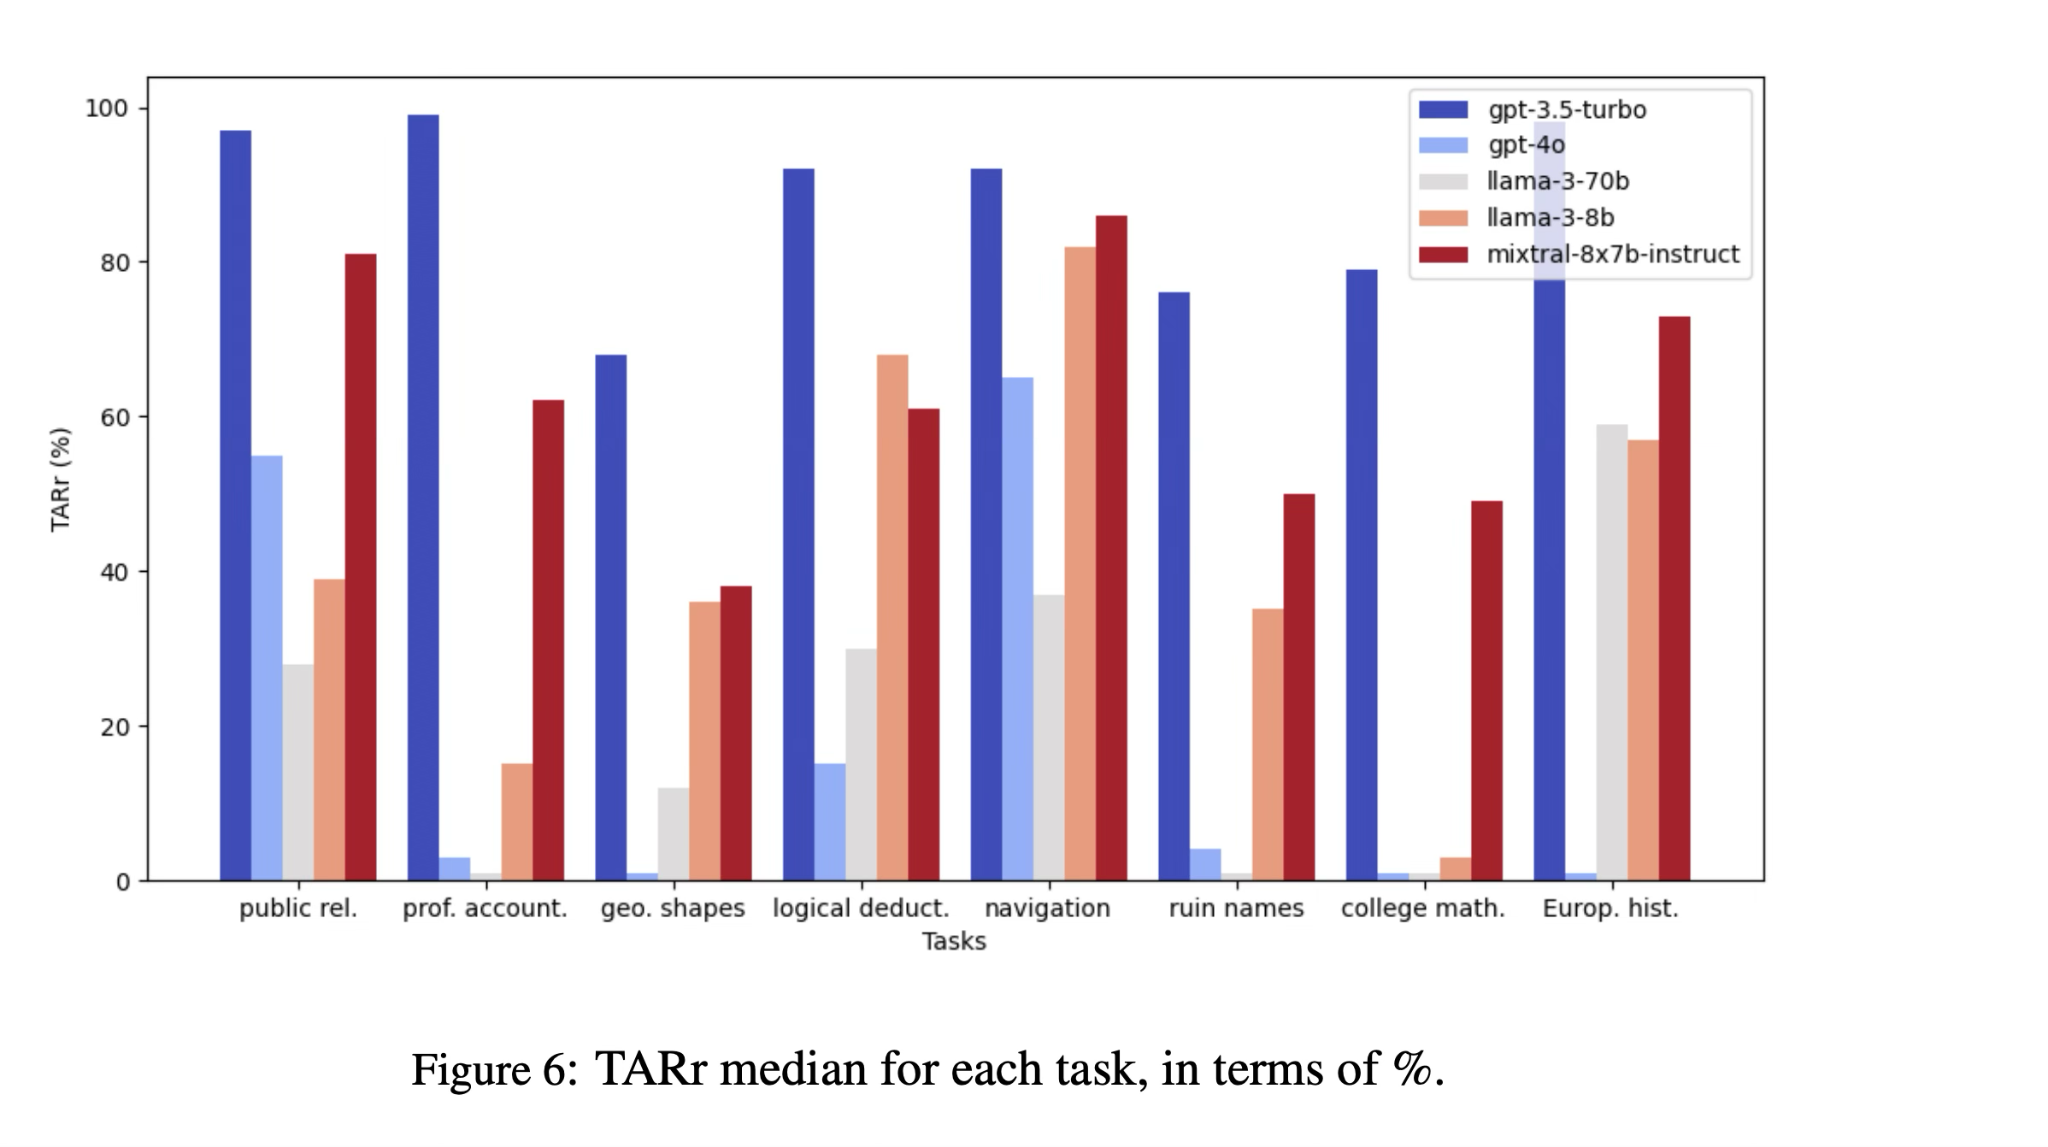
A 2024 study by Atil et. al tested five models across eight tasks under deterministic settings and found accuracy swinging by as much as 15% across otherwise identical runs, with the gap between the best and worst run reaching 70% on some tasks.
Not one of the models delivered repeatable results across all of them.
For a long time the industry explained this away as floating-point math and thread ordering, the kind of low-level noise you shrug at.
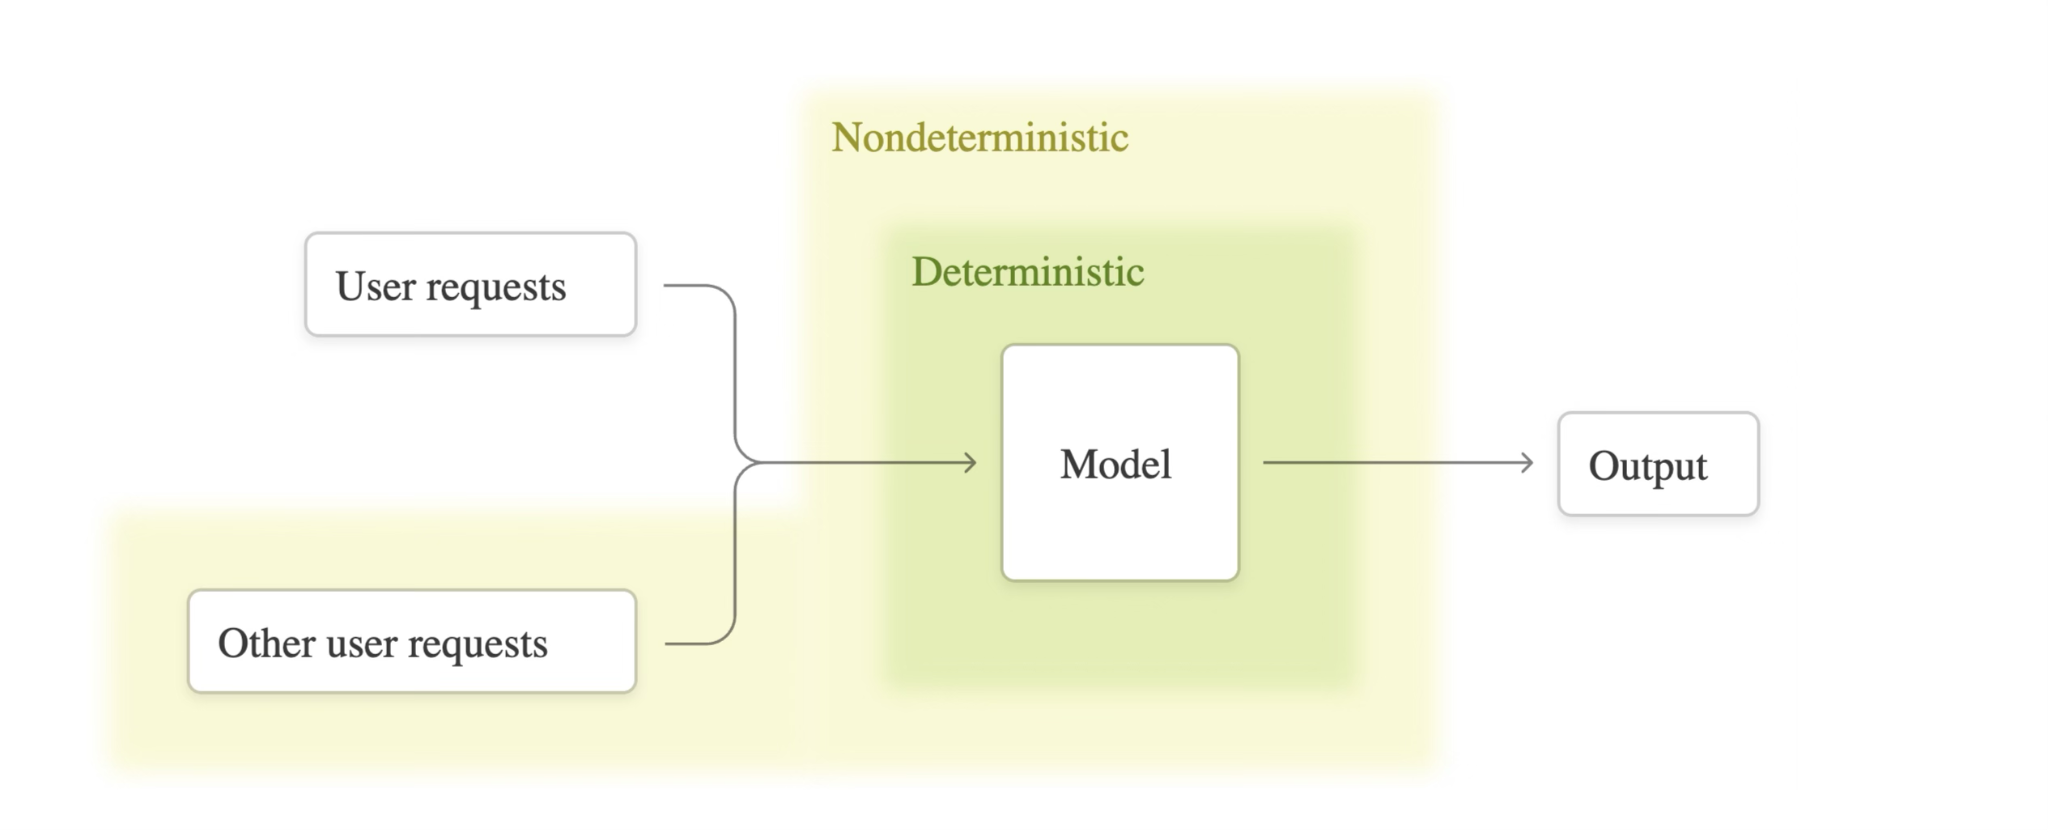
Research from ThinkingMachines complicated that story by showing the larger culprit is batch-size variance. When your request hits a production API, it gets batched with other users’ requests, the batch size shifts with server load, and that shift alone produces different output.
The same research generated eighty unique completions from a thousand identical prompts.
The Third Fork: This Month’s Citations Are Not Next Month’s
Even a tool that queries correctly and repeats enough to smooth out the noise faces a third problem, and it may be the one that does the most damage to naive measurement.
The sources an AI cites for a given question change constantly, on a timescale far faster than anyone accustomed to SEO would expect.
Profound put a number on this that has since become the reference point for the whole conversation. Tracking a large body of ChatGPT citations, its research found that 40 to 60% of cited domains change from one month to the next, even for identical prompts.
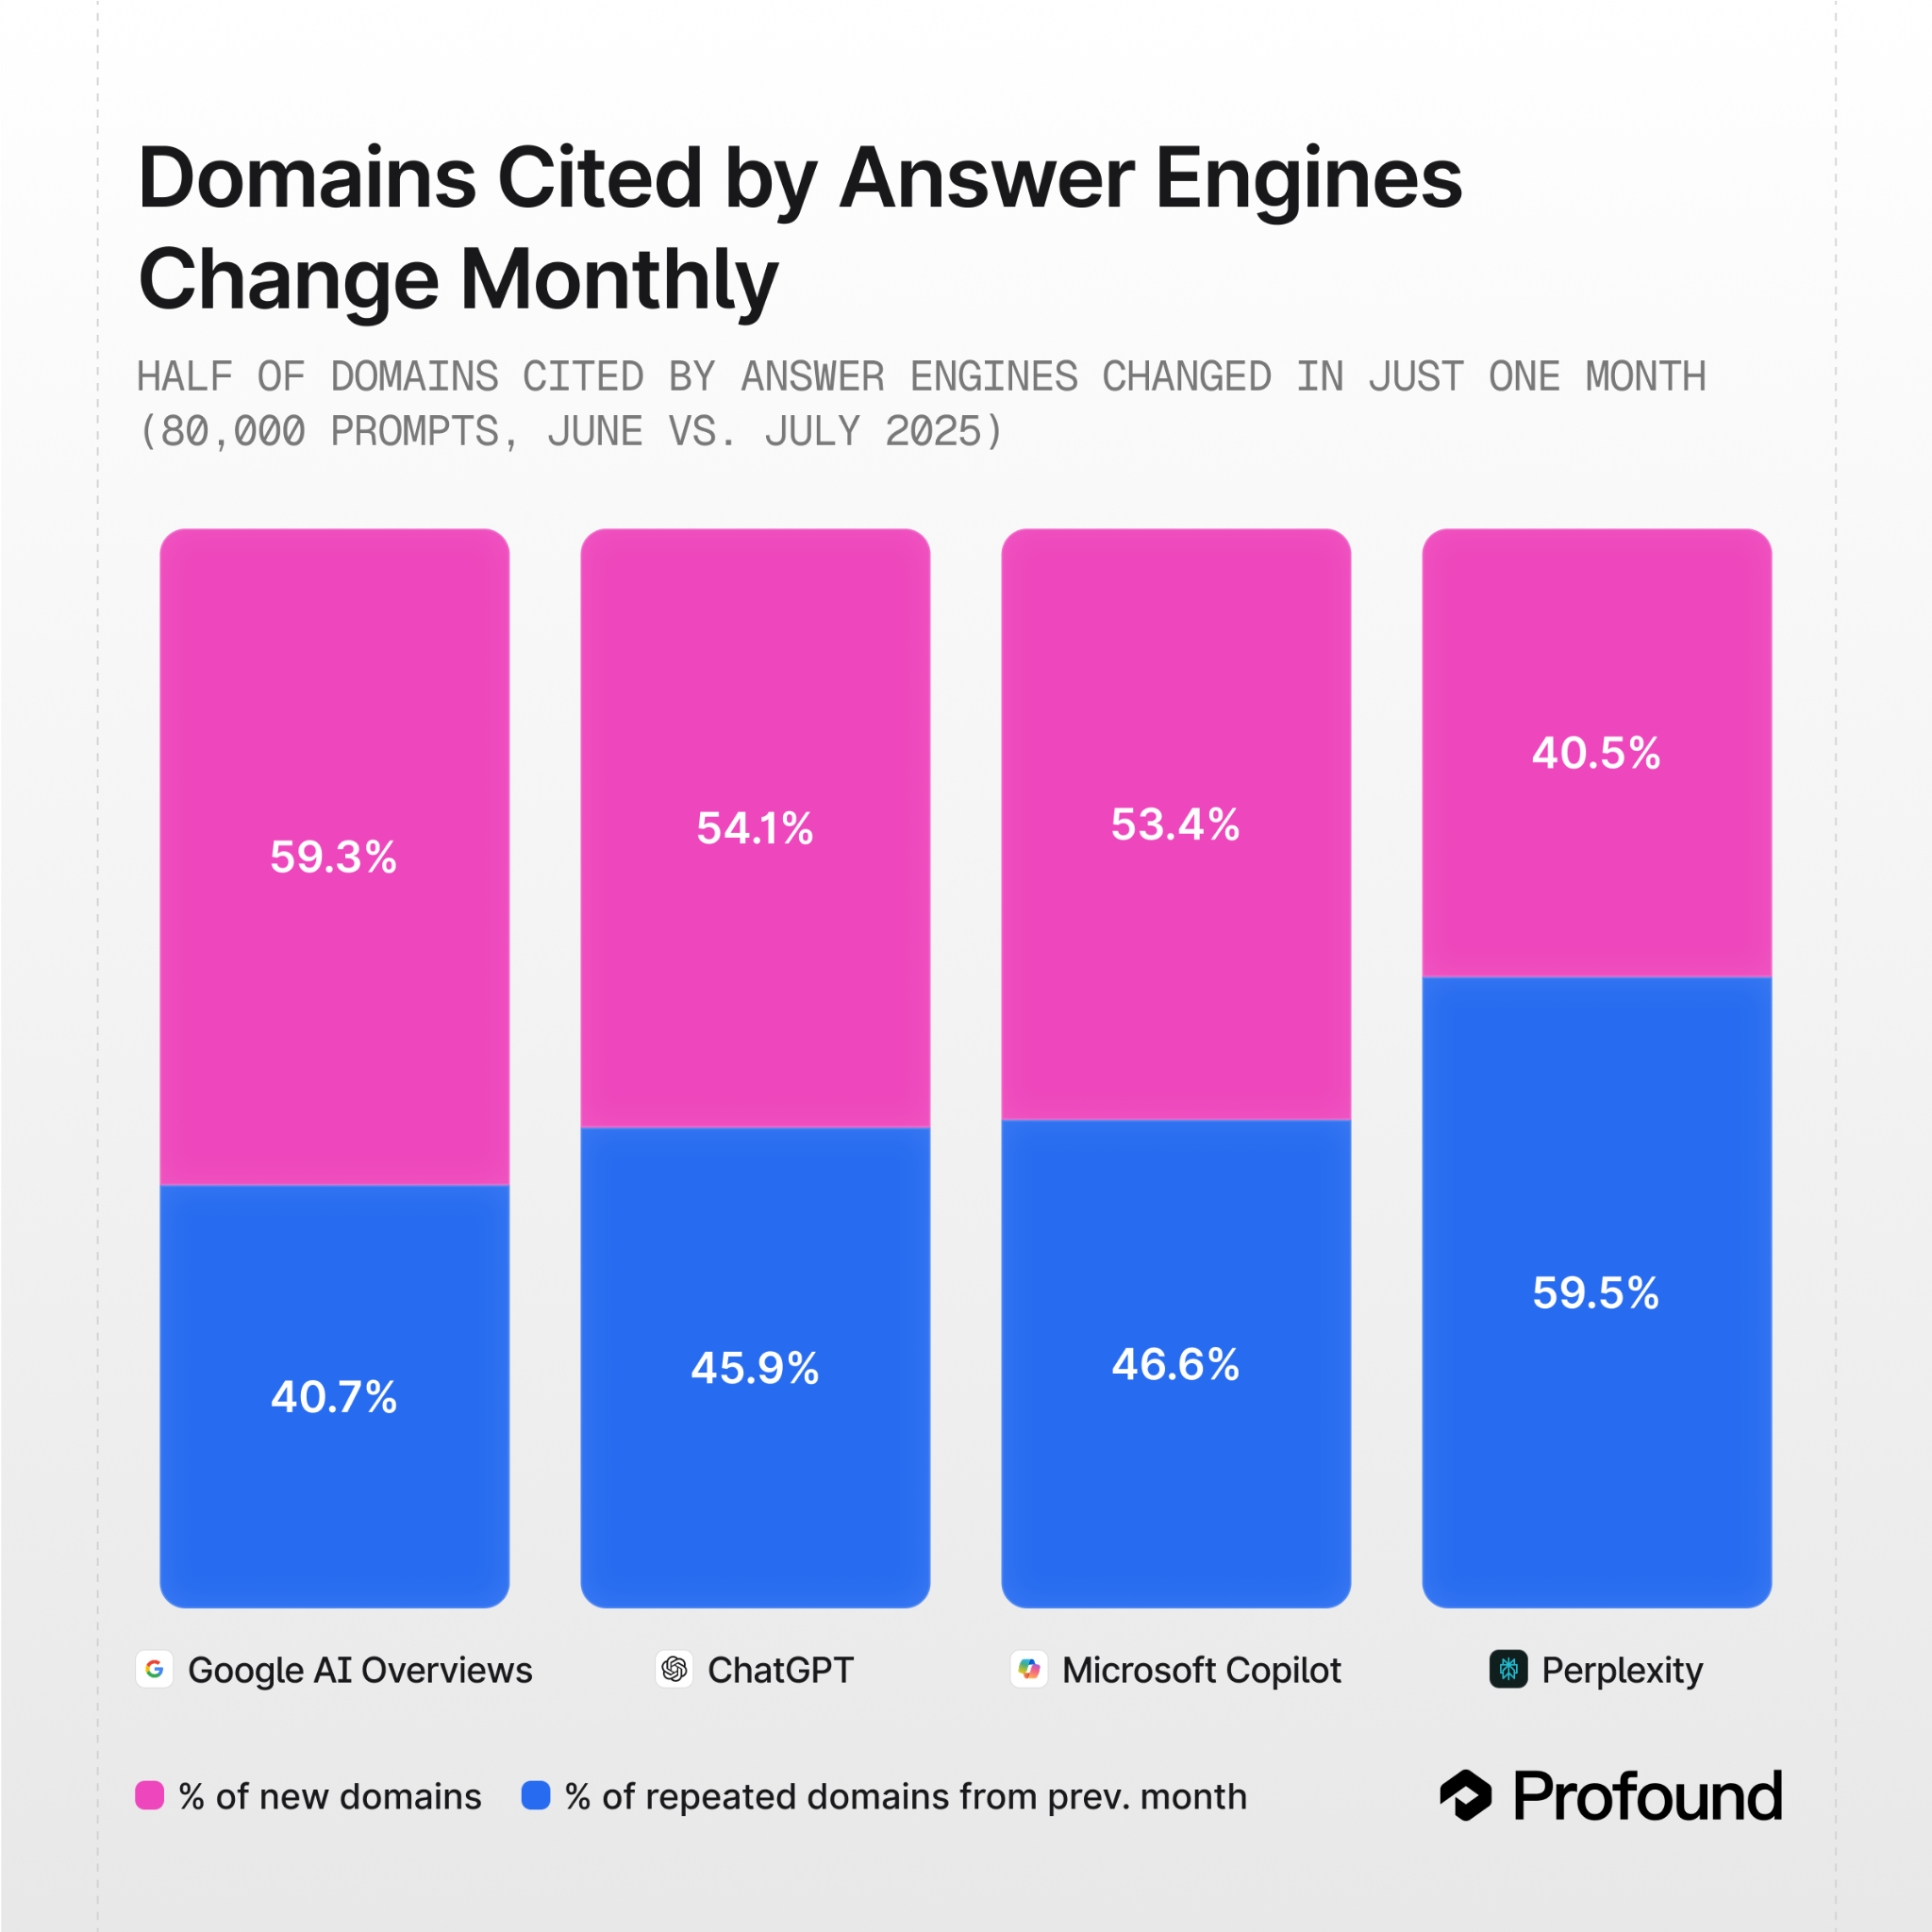
Google’s AI Overviews showed the highest churn at 59.3%, with ChatGPT at 54.1%, Microsoft Copilot at 53.4%, and Perplexity the most stable at 40.5%.
Extended out to six months, 70 to 90% of cited domains are completely different from where they started.
A brand cited in an answer today has a meaningful chance of being replaced next month. This isn’t because it did anything wrong, but because the model refreshed its retrieval or reweighted which kinds of sources it trusts.
The 2026 State of AI Search from AirOps also confirms this with their report showing only 30% stay visible from one answer to the next.
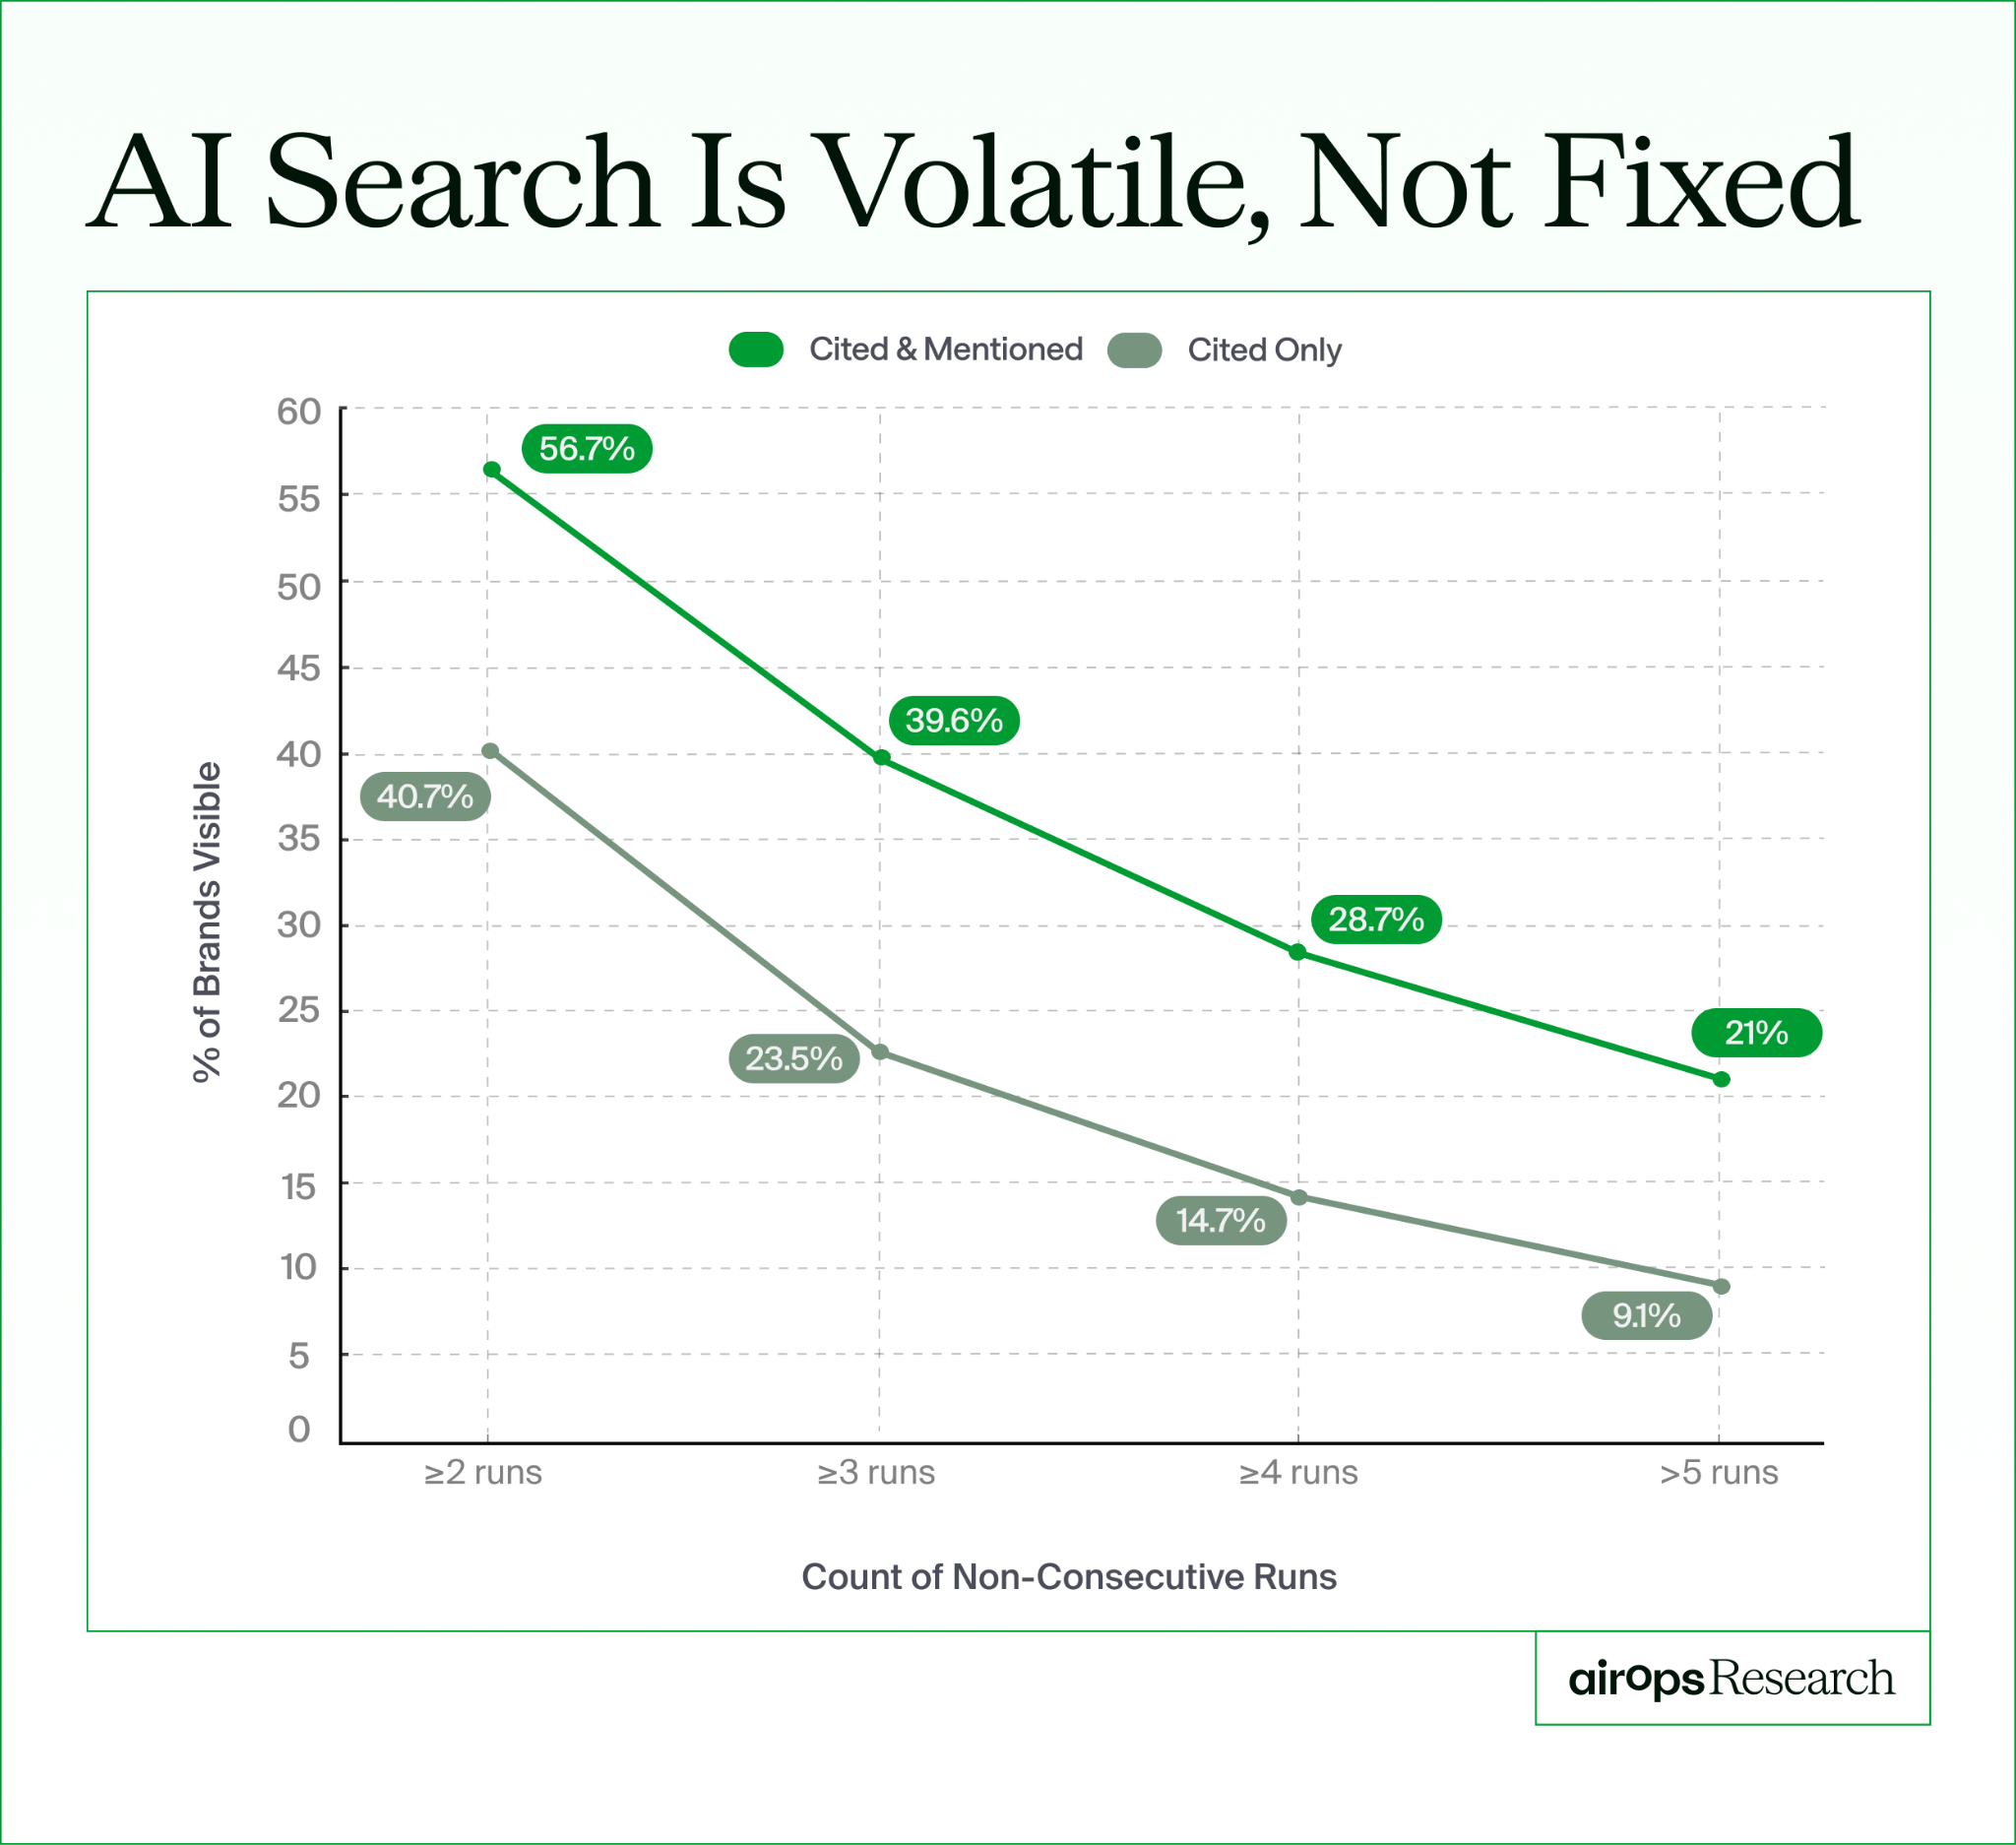
In another study, SISTRIX ran its own investigation across 82,619 prompts over seventeen weeks in six countries and confirmed the volatility.
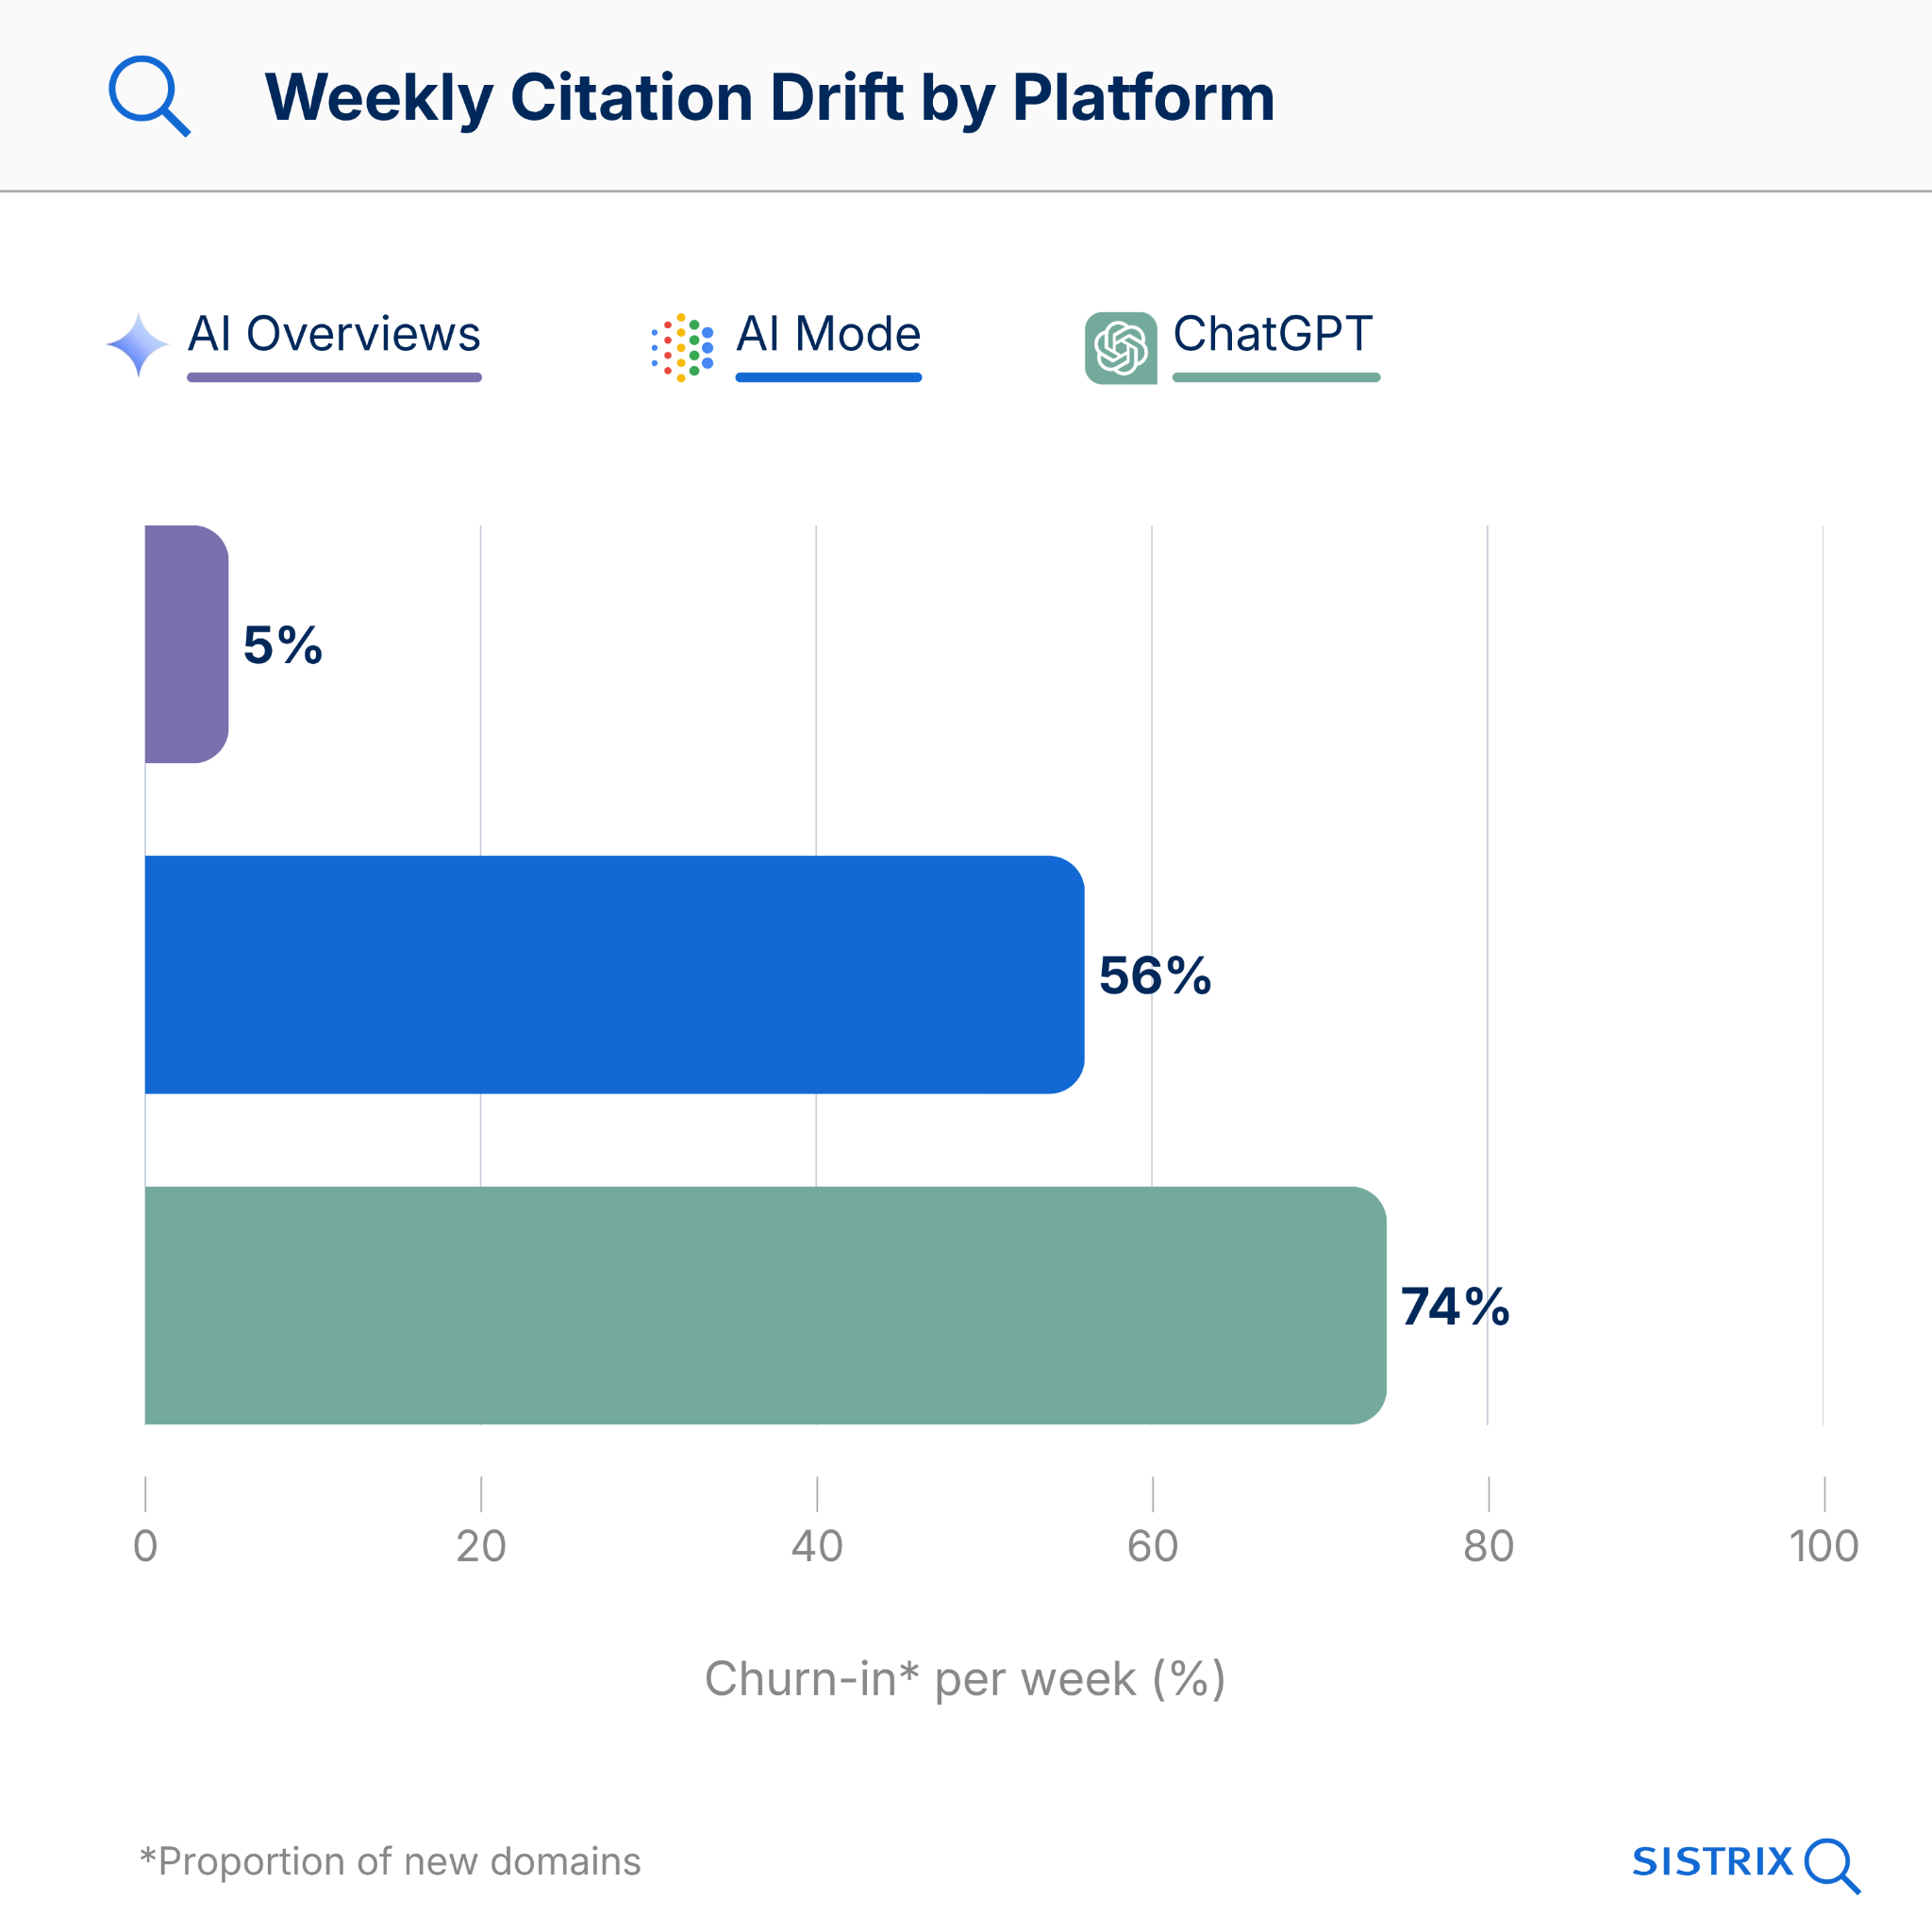
In Google’s AI Mode, SISTRIX found that most responses have a stable core of a few anchored domains alongside a rotating carousel. For 86% of prompts there is a fixed core, while the rest churns at roughly 89% per week.
The strategic question, in their framing, becomes whether your brand sits in the core or in the carousel.
SISTRIX also found the drift rate varies by country in ways that expose how uneven crawl coverage is across languages. ChatGPT was far more volatile in Germany, at 74% weekly churn, than in the UK at 60% or France at 42%. Across the full seventeen weeks, the drift showed no sign of settling down.
Anyone waiting for the models to agree on a stable set of sources, they noted, may be waiting a long time.
The single most vivid example of drift came from Semrush’s longitudinal tracking, which caught ChatGPT’s citation share for Reddit collapsing from roughly 60% to about 10% within a few weeks in September 2025.
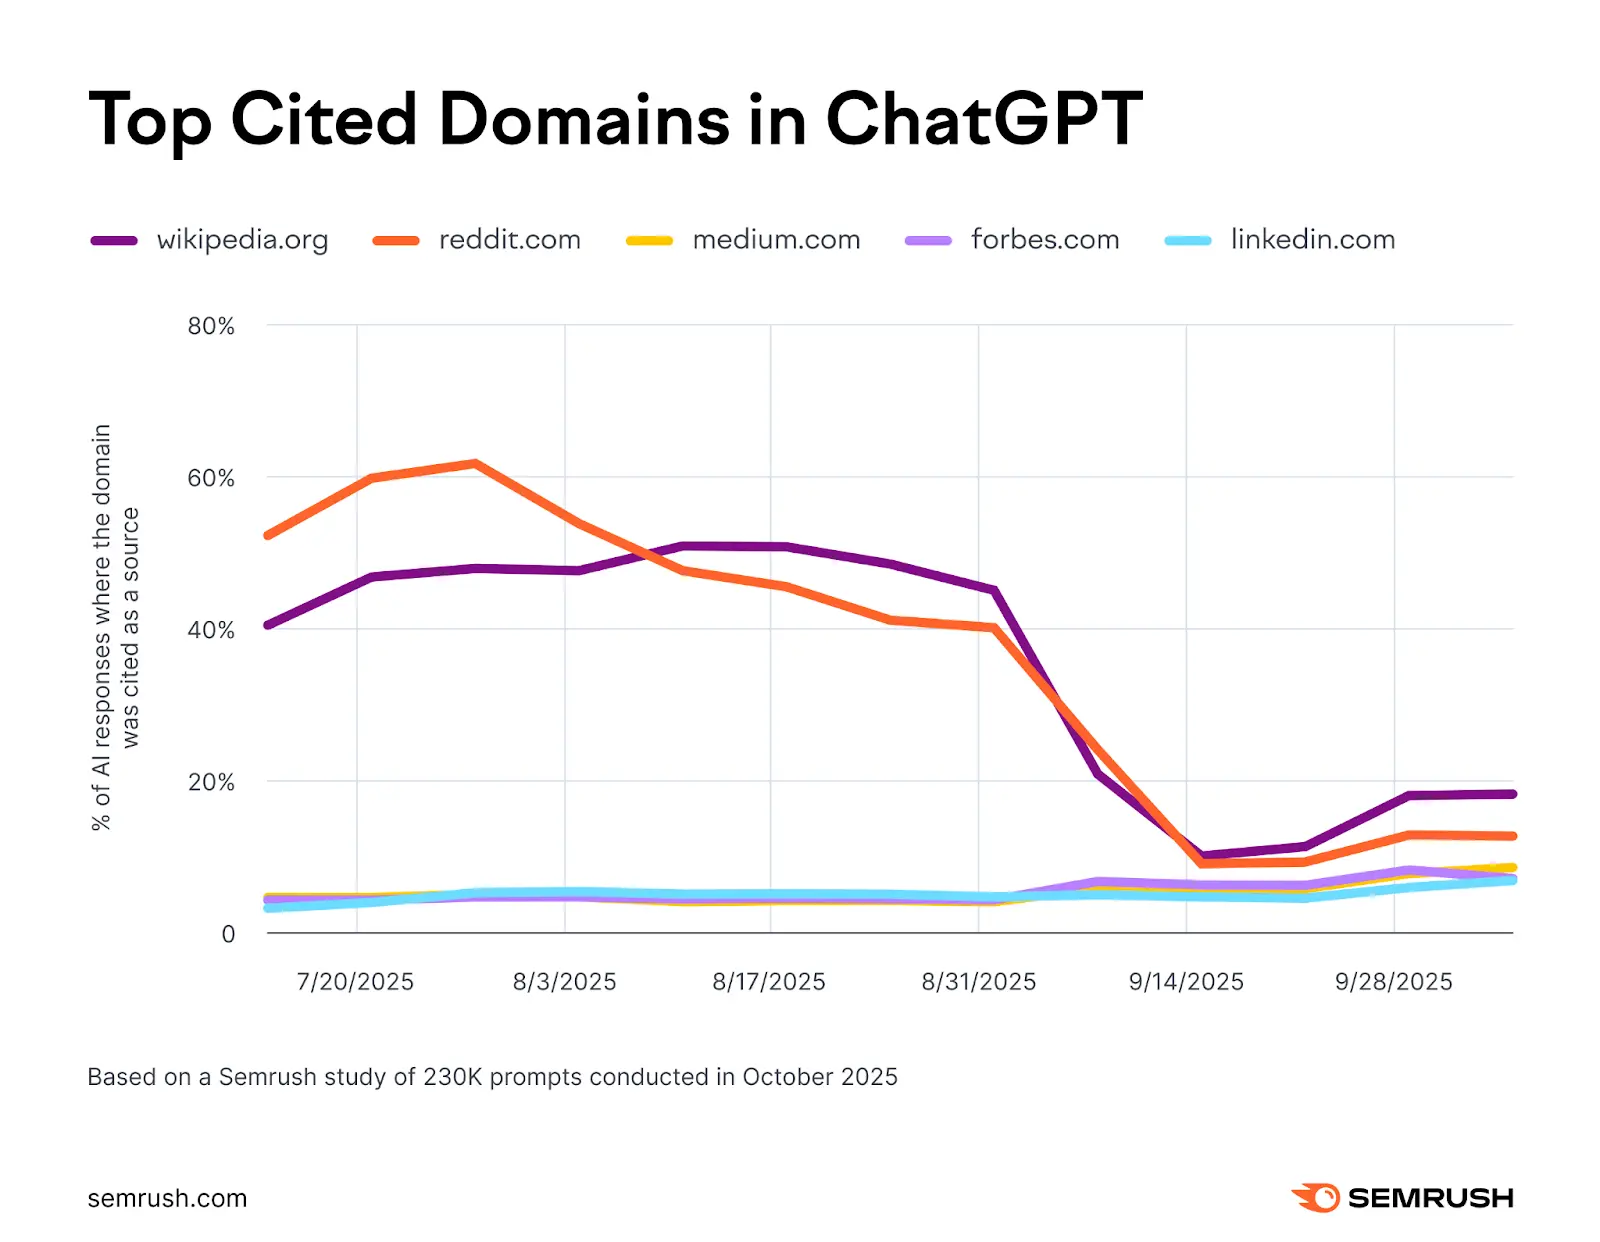
That chart looked like an overnight reweighting of an entire source type, affecting every query where Reddit had been dominant.
Scrunch and Stacker’s research put the average citation half-life on ChatGPT at around 3.4 weeks, meaning a typical citation loses half its staying power in under a month.
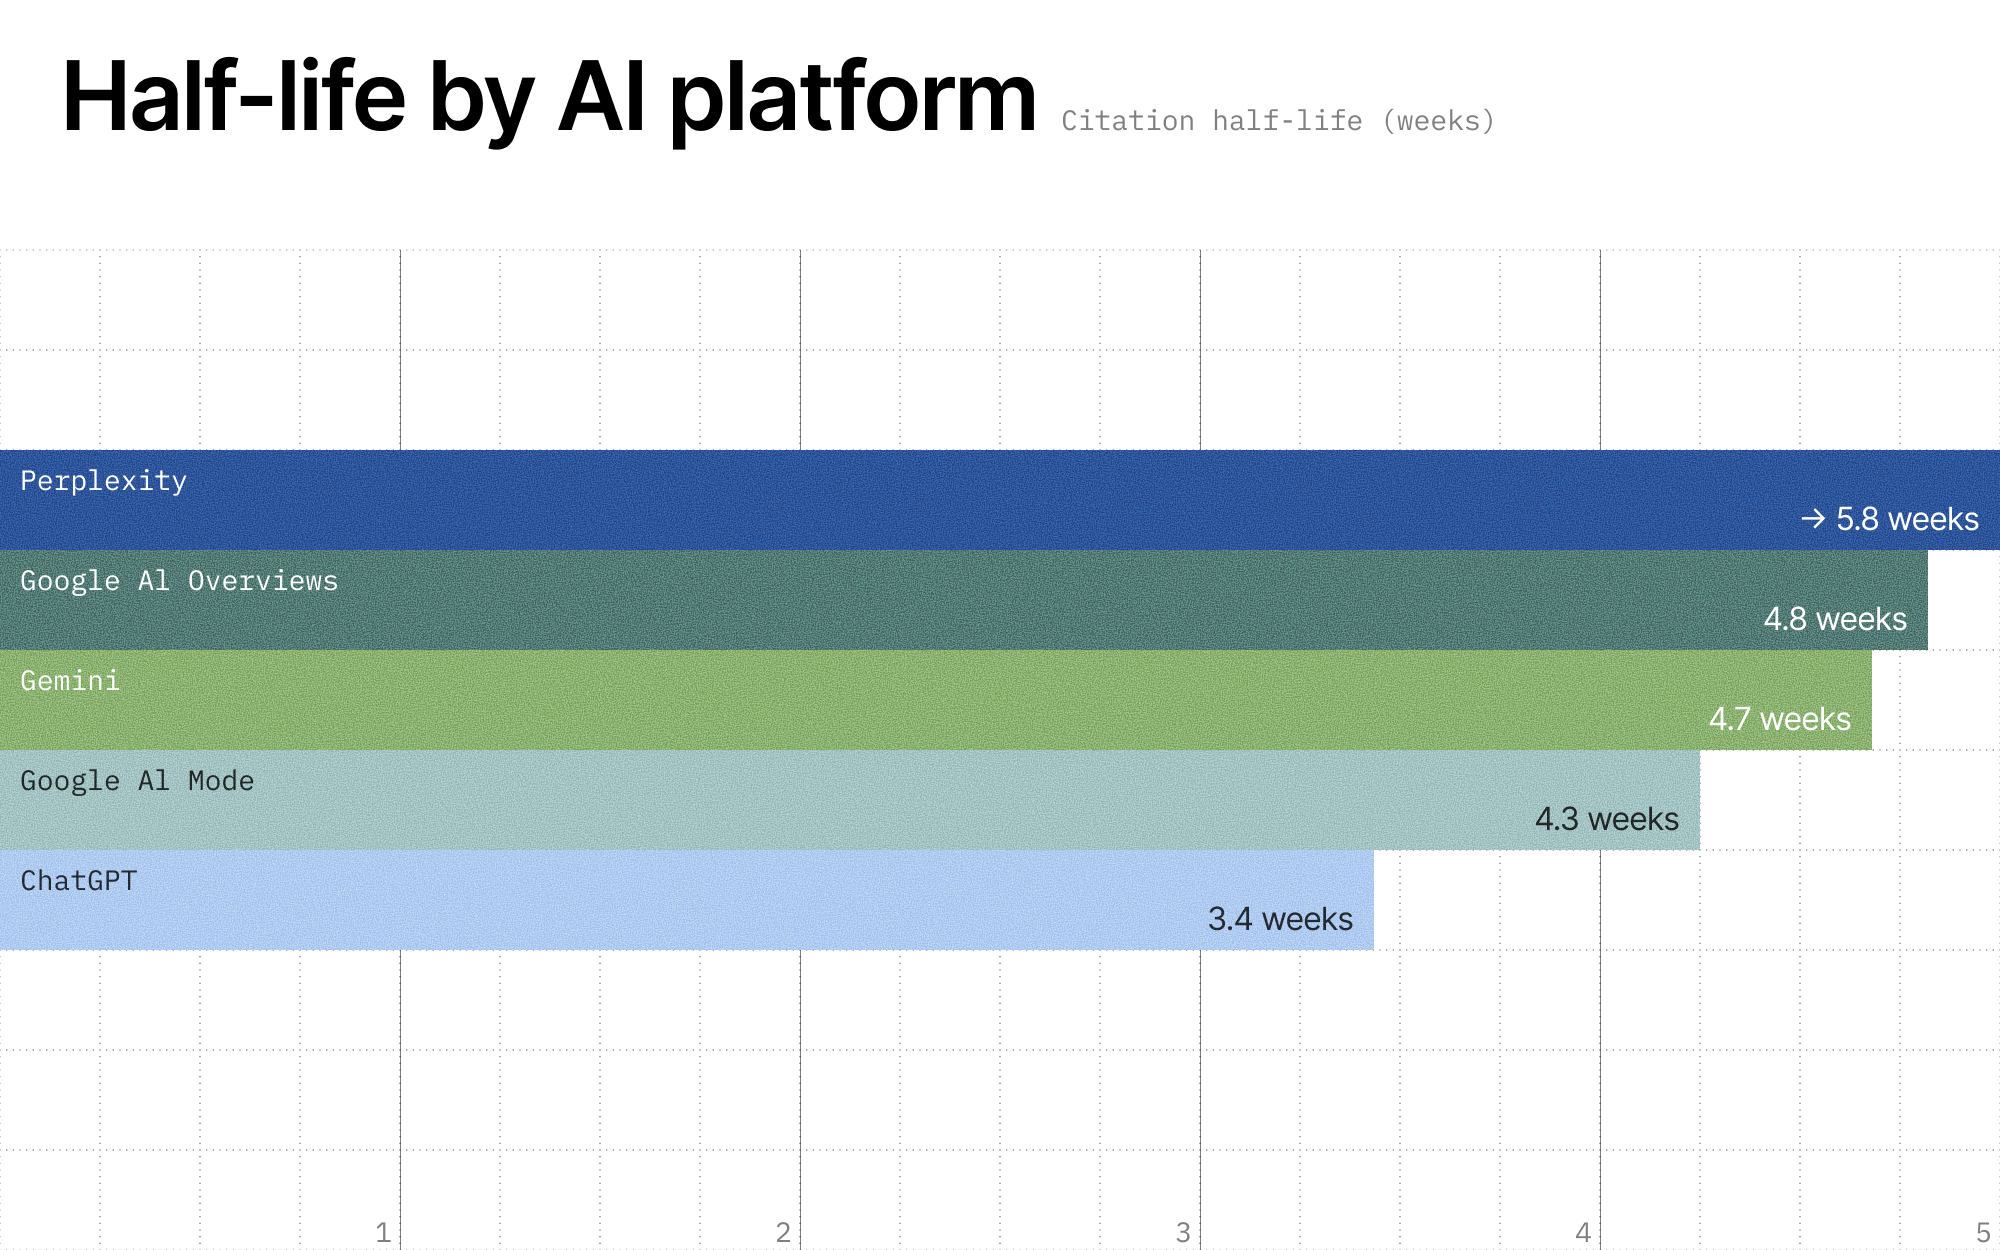
Put the five findings together and the implication for measurement is unavoidable.
If cited domains turn over 40 to 60% monthly, a tool that measures monthly is comparing two snapshots that are half different by construction, and it cannot tell you whether a drop is a real loss or ordinary churn.
As Nick Lafferty puts it:
“With churn that high, a platform with a shallow history can’t tell you whether a visibility drop is a real loss or background noise. You need months of baseline data before a trend line means anything, which makes retention depth a decision-critical buying criterion, and one almost no AEO vendor talks about.”
The Fourth Fork: Nobody Agrees What Visibility Means
The three forks so far are all about how the data is collected. The fourth is more basic and, in some ways, more embarrassing for the field.
The industry has not settled on what it is counting.
Walk through the leading tools and consultants and you will find at least six different metrics, all sometimes called “visibility,” all calculated differently.
- There is share of voice, the percentage of tracked answers where your brand appears at all.
- There is share of answer, how much of the actual response text your brand occupies.
- There is share of citation, whether your specific URL is linked.
- There is share of mention, whether your brand name shows up anywhere in the text.
- There is share of model, popularized by Profound and Foundation, which measures your presence across a topic cluster against every brand that could appear.
- And there is recommendation rate, which counts only explicit endorsements rather than any mention.
A thorough breakdown by LLM Pulse lays out three of these variants with separate formulas for each, and notes that a brand can score well on one and poorly on another for the same prompt set at the same moment.

These are also not interchangeable. Being named in passing, being quoted at length, being the linked source, and being the recommended choice are four different competitive positions, and collapsing them into one word produces confusion that compounds.
A 2026 measurement study analyzing 21,143 citations revealed the difference between citation selection, making it onto the reference list, and citation absorption, actually shaping the words of the answer.
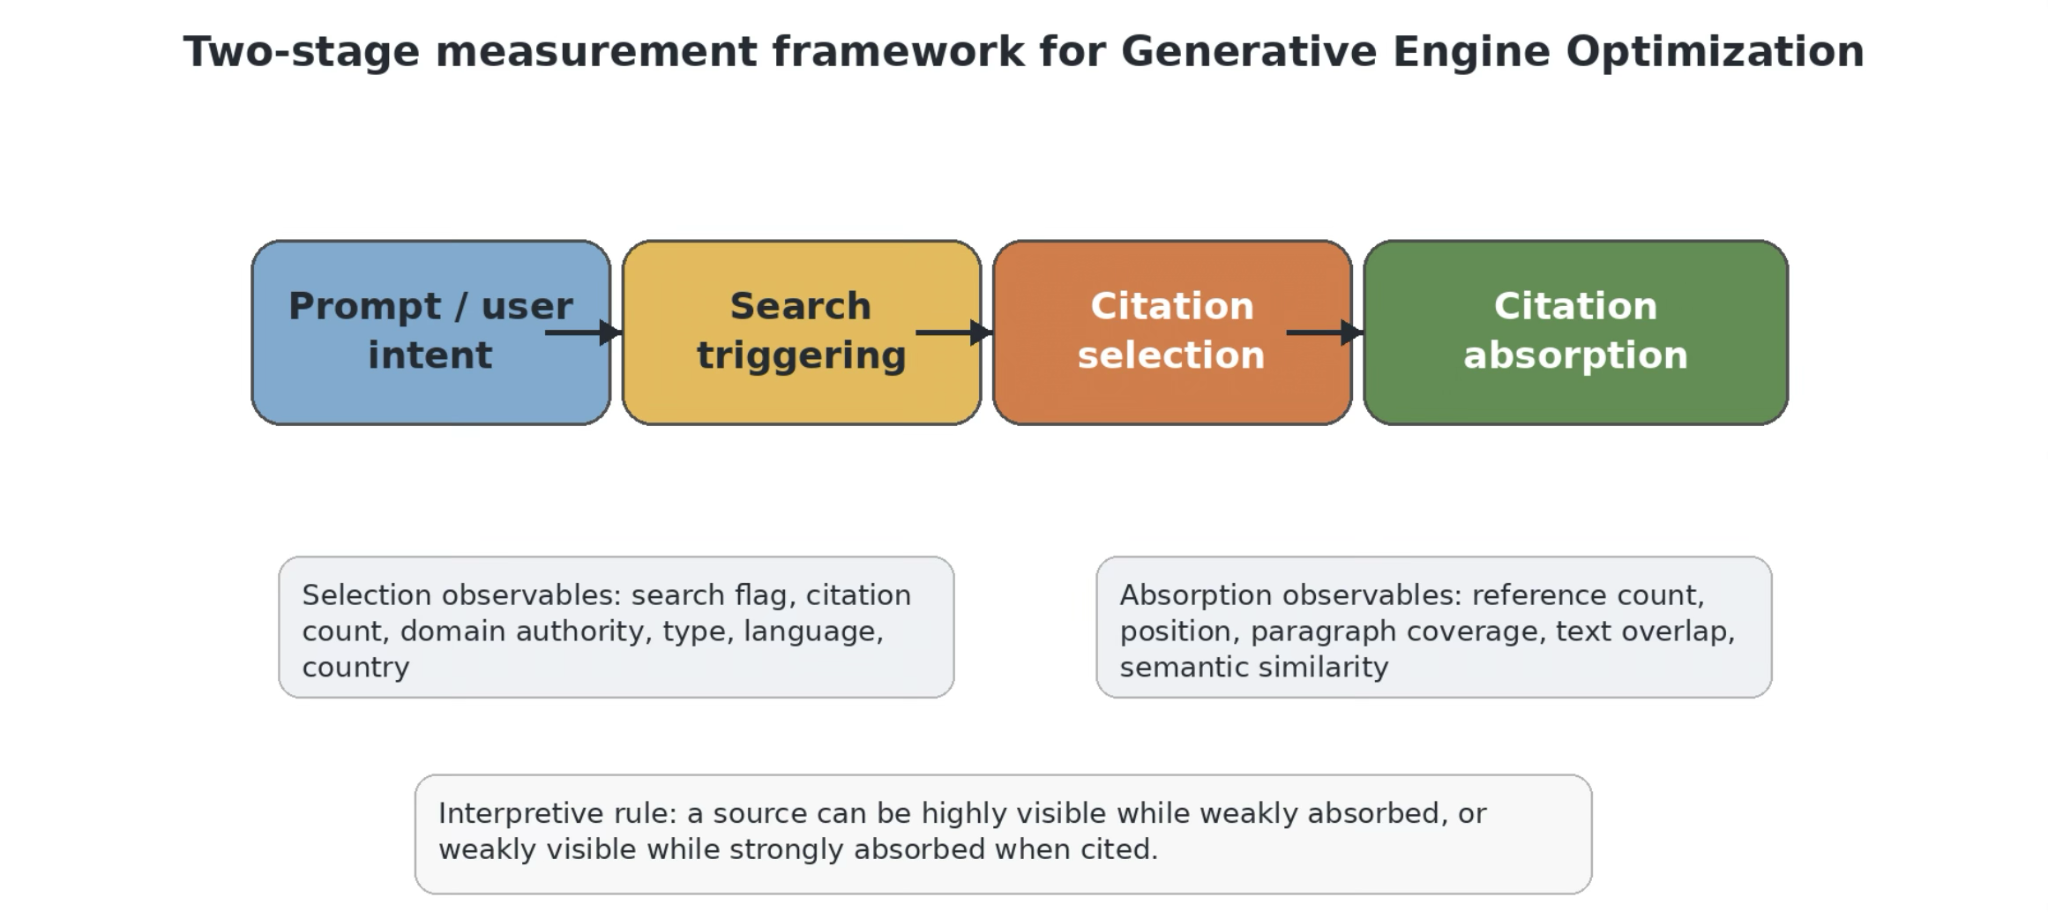
The same study found Perplexity cites many sources per prompt but draws lightly from each, while ChatGPT cites fewer but extracts more from every one.
As such, a brand can sit in Perplexity’s footnotes without touching the answer, or appear once in ChatGPT and shape two paragraphs. A single blended number hides exactly this, which is the strategic information you would want.
The disagreement extends to what a good score even is.
OptimizeGEO pegs under 15% as a significant citation gap and 25 to 40% as competitive, while noting even category leaders rarely clear 60%.
AthenaHQ’s State of AI Search 2026 report pushes that number higher with most brand mention rate across AI answers sitting within 16.05% - 17.20%.
The blunt version of the problem appeared in Tim de Rosen’s comment on AirOps’ measurement guide. He argues that citation rates vary as much as forty-six-fold across platforms, so a single methodology hides more than it reveals.

The Engines Can’t Be Used Together
Everything above argues against a habit that most reporting still indulges—the single, cross-engine visibility score.
The deeper reason to distrust that number is that the engines behave so differently from one another that averaging them destroys the signal.
I ran into this directly in my own research. In the Query Fan-Out Experiment, I put 270 queries through ChatGPT, Gemini, and Perplexity across three B2B software categories and tracked how each engine assembled its recommendations.
- Perplexity ran a live web search on effectively every query.
- ChatGPT searched on roughly 44% of them and answered the rest from its trained parameters.
This means a brand’s chances in Perplexity depends heavily on what is freshly crawlable, while its chances in ChatGPT depends more on what the model already absorbed during training.
Perplexity also pulled far more sources into each answer, around 4.2 on average, against roughly 1.7 for ChatGPT, which makes ChatGPT a winner-take-most surface and Perplexity a broader one.
With all of this, a blended “AI visibility” figure that averages a brand’s standing across engines is averaging across machines that reward different things, retrieve differently, and cite differently.
Google Built Its Own Measure, and It Only Goes Halfway
The largest AI search surface is Google’s AI Overviews. Early this year, BrightEdge tracking put AI Overviews on roughly 48% of queries, up around 58% year over year, with health, education, and research verticals triggering them on close to 80% of searches.
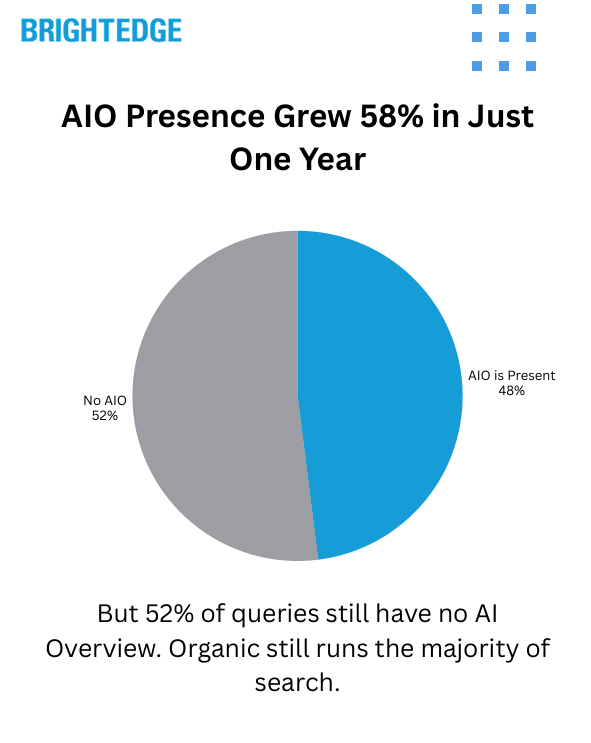
Whatever is happening in ChatGPT and Perplexity, this is the surface with the reach.
The trouble is that measuring Google’s AI impact turned into its own contested exercise, with different studies landing on numbers that do not line up.
- Ahrefs, analyzing Search Console data across 300,000 keywords in December 2025, reported that the top-ranking page loses about 58% of its click-through rate when an AI Overview appears, up from a 34.5% drop measured in April 2025.
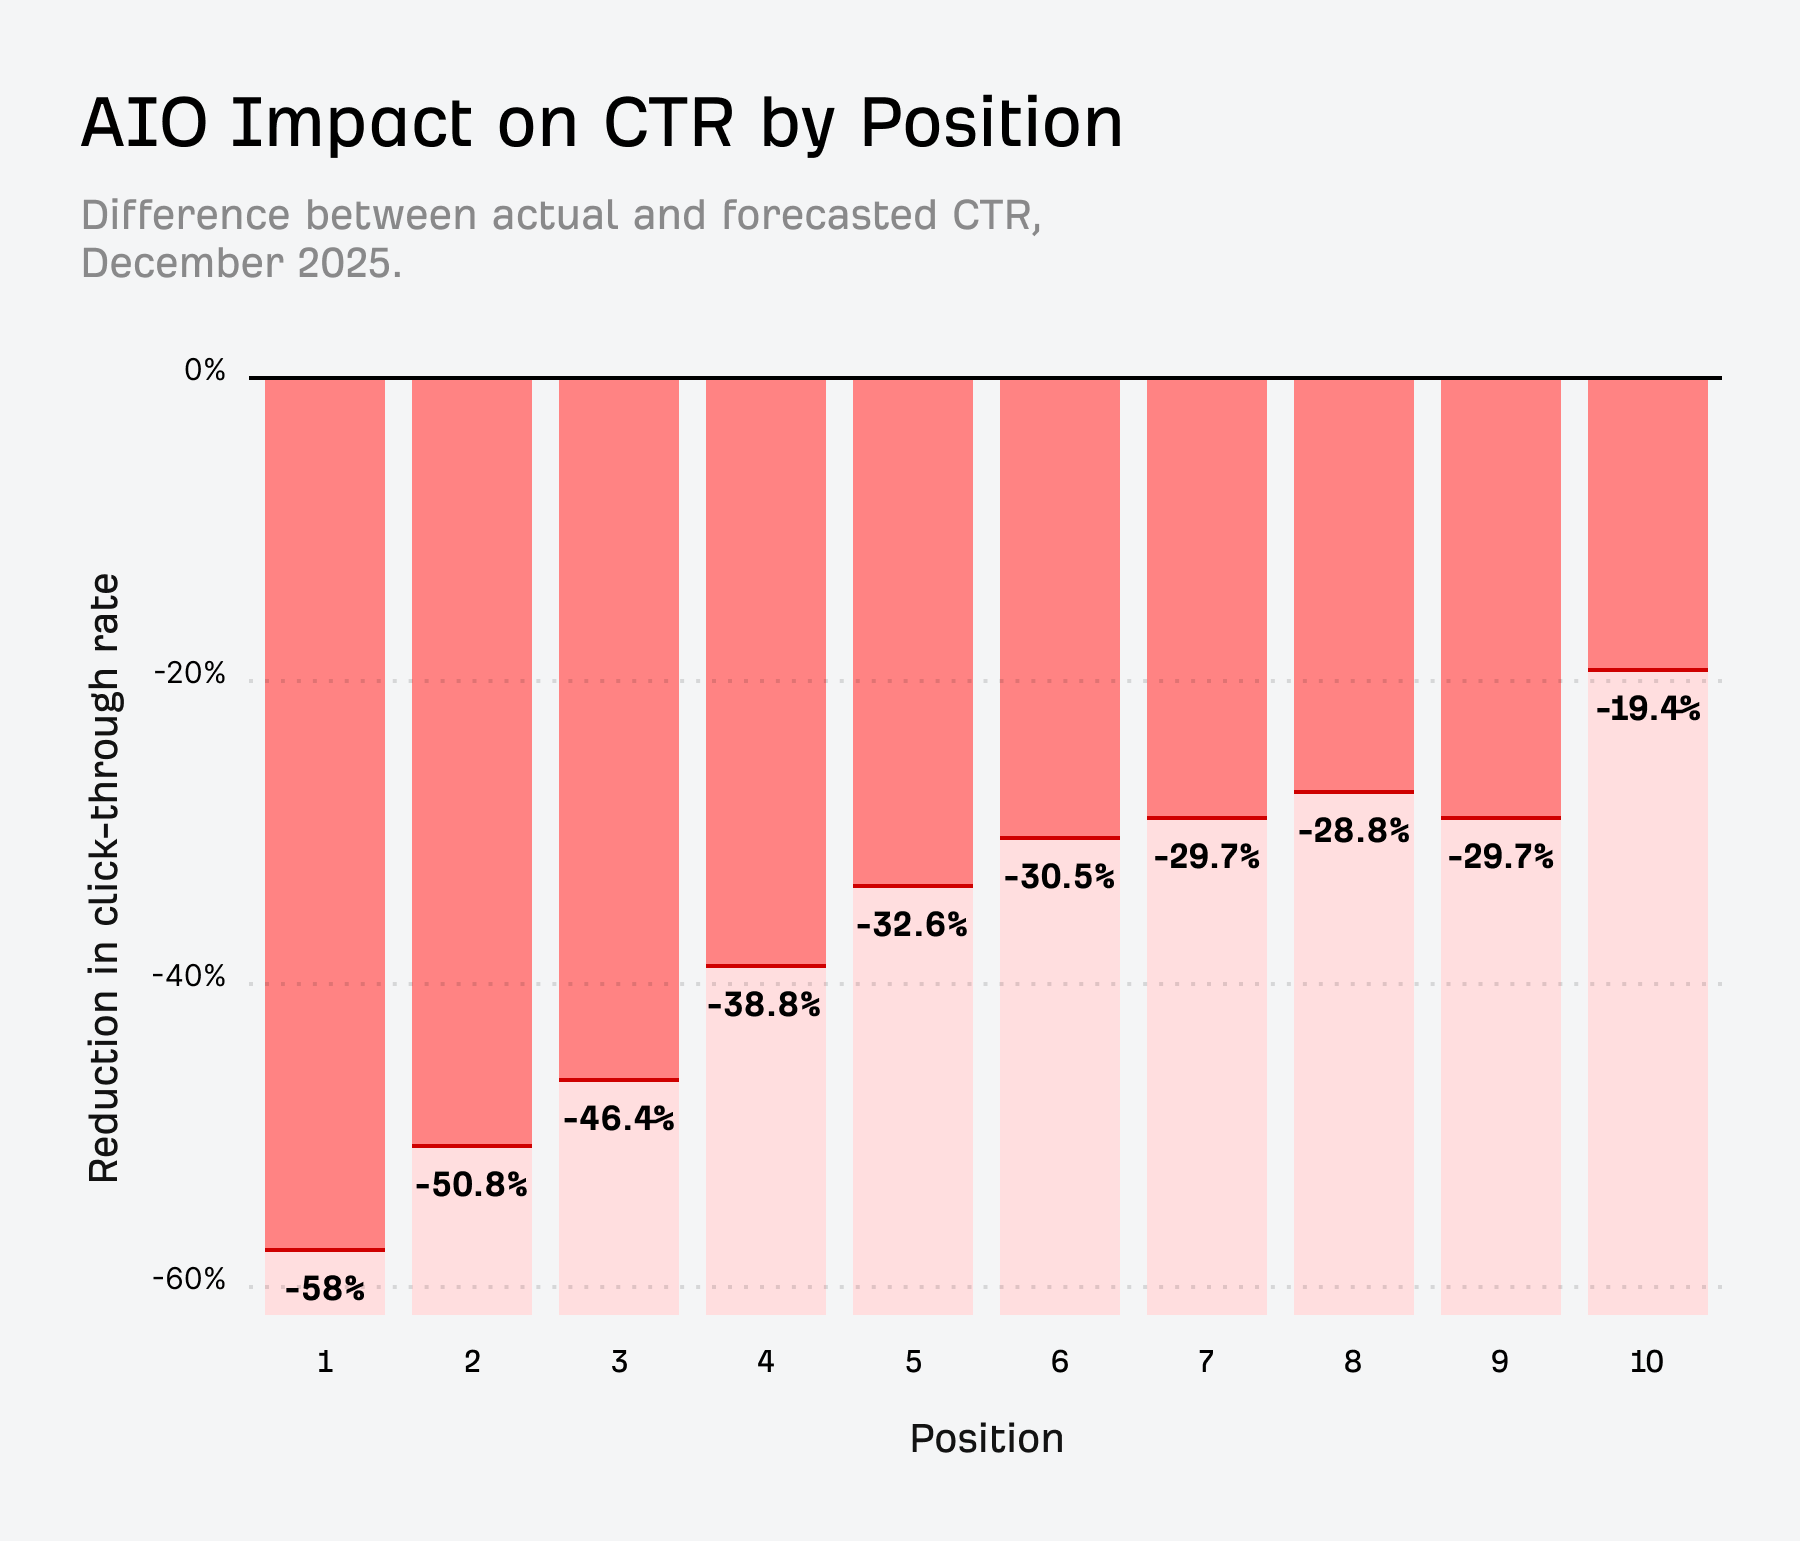
- Pew Research, tracking real browsing behavior, found users click 8% of the time when an AI Overview is present against 15% without, a relative decline near 47%.

- Seer Interactive, which has published one of the longer-running longitudinal studies of AI Overview click-through rates, found that organic CTR on affected queries fell from 1.76% in June 2024 to 0.61% in September 2025, a decline of roughly 65%.
- Its expanded 2026 study then found an early rebound, with CTR rising from 1.3% in December 2025 to 2.4% in February 2026. But Seer described this stabilization as tentative.
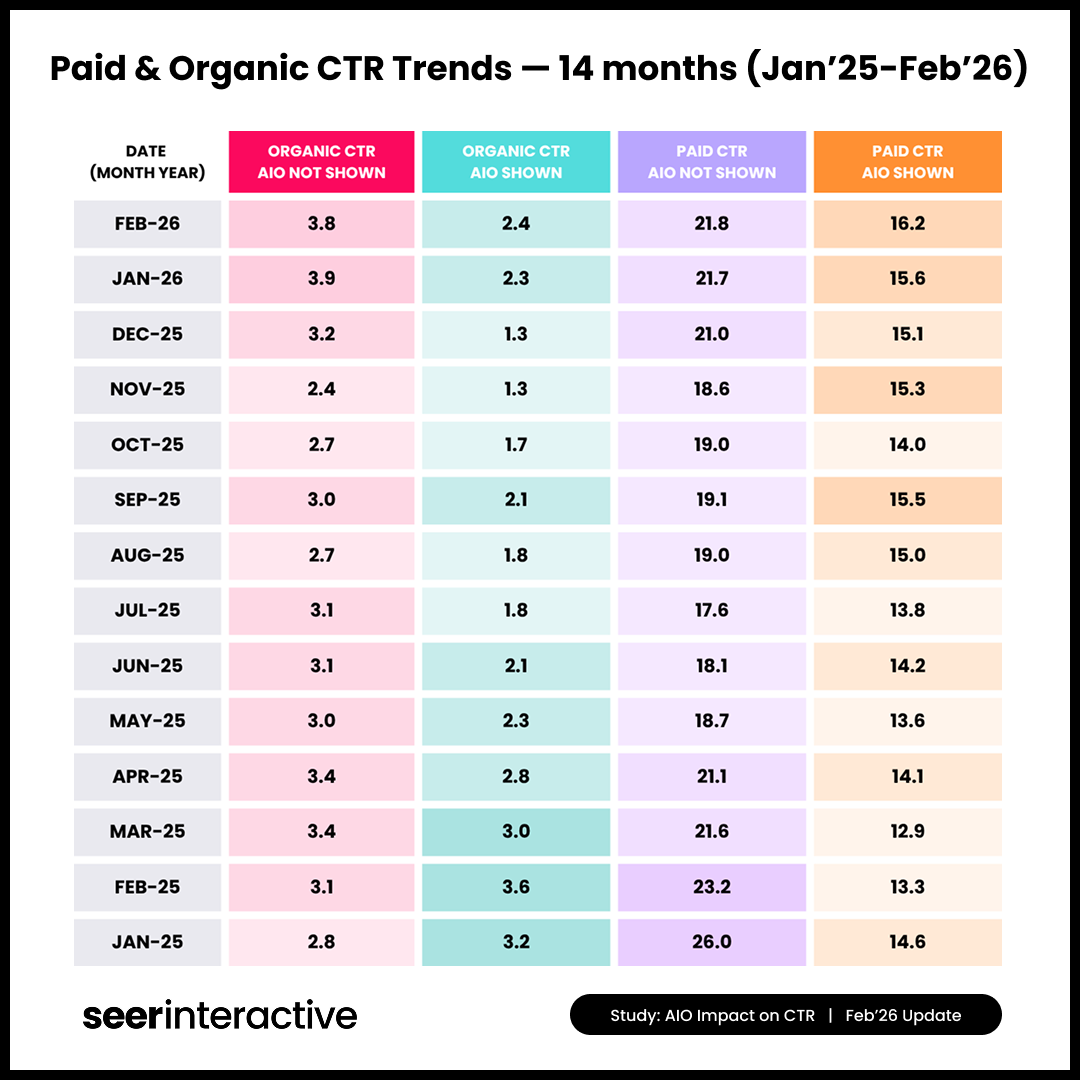
They all sound contradictory until you understand that they measure different things.
- Ahrefs measures top-page CTR for AIO keywords,
- Pew measures browsing click rate,
- and Seer tracks brand-level CTR over time.
All three point in the same direction while resisting a clean headline.
The most rigorous evidence came from a pre-registered field experiment run between January and February 2026, which randomly assigned users to see AI Overviews or have them removed.
Removing them raised outbound clicks from 0.38 to 0.61 per search. The presence of an Overview cut outbound organic clicks by 38% on triggered queries, and pushed zero-click rates from 54% up to 72%.
Because the study randomized exposure rather than merely observing it, it isolated the causal effect.
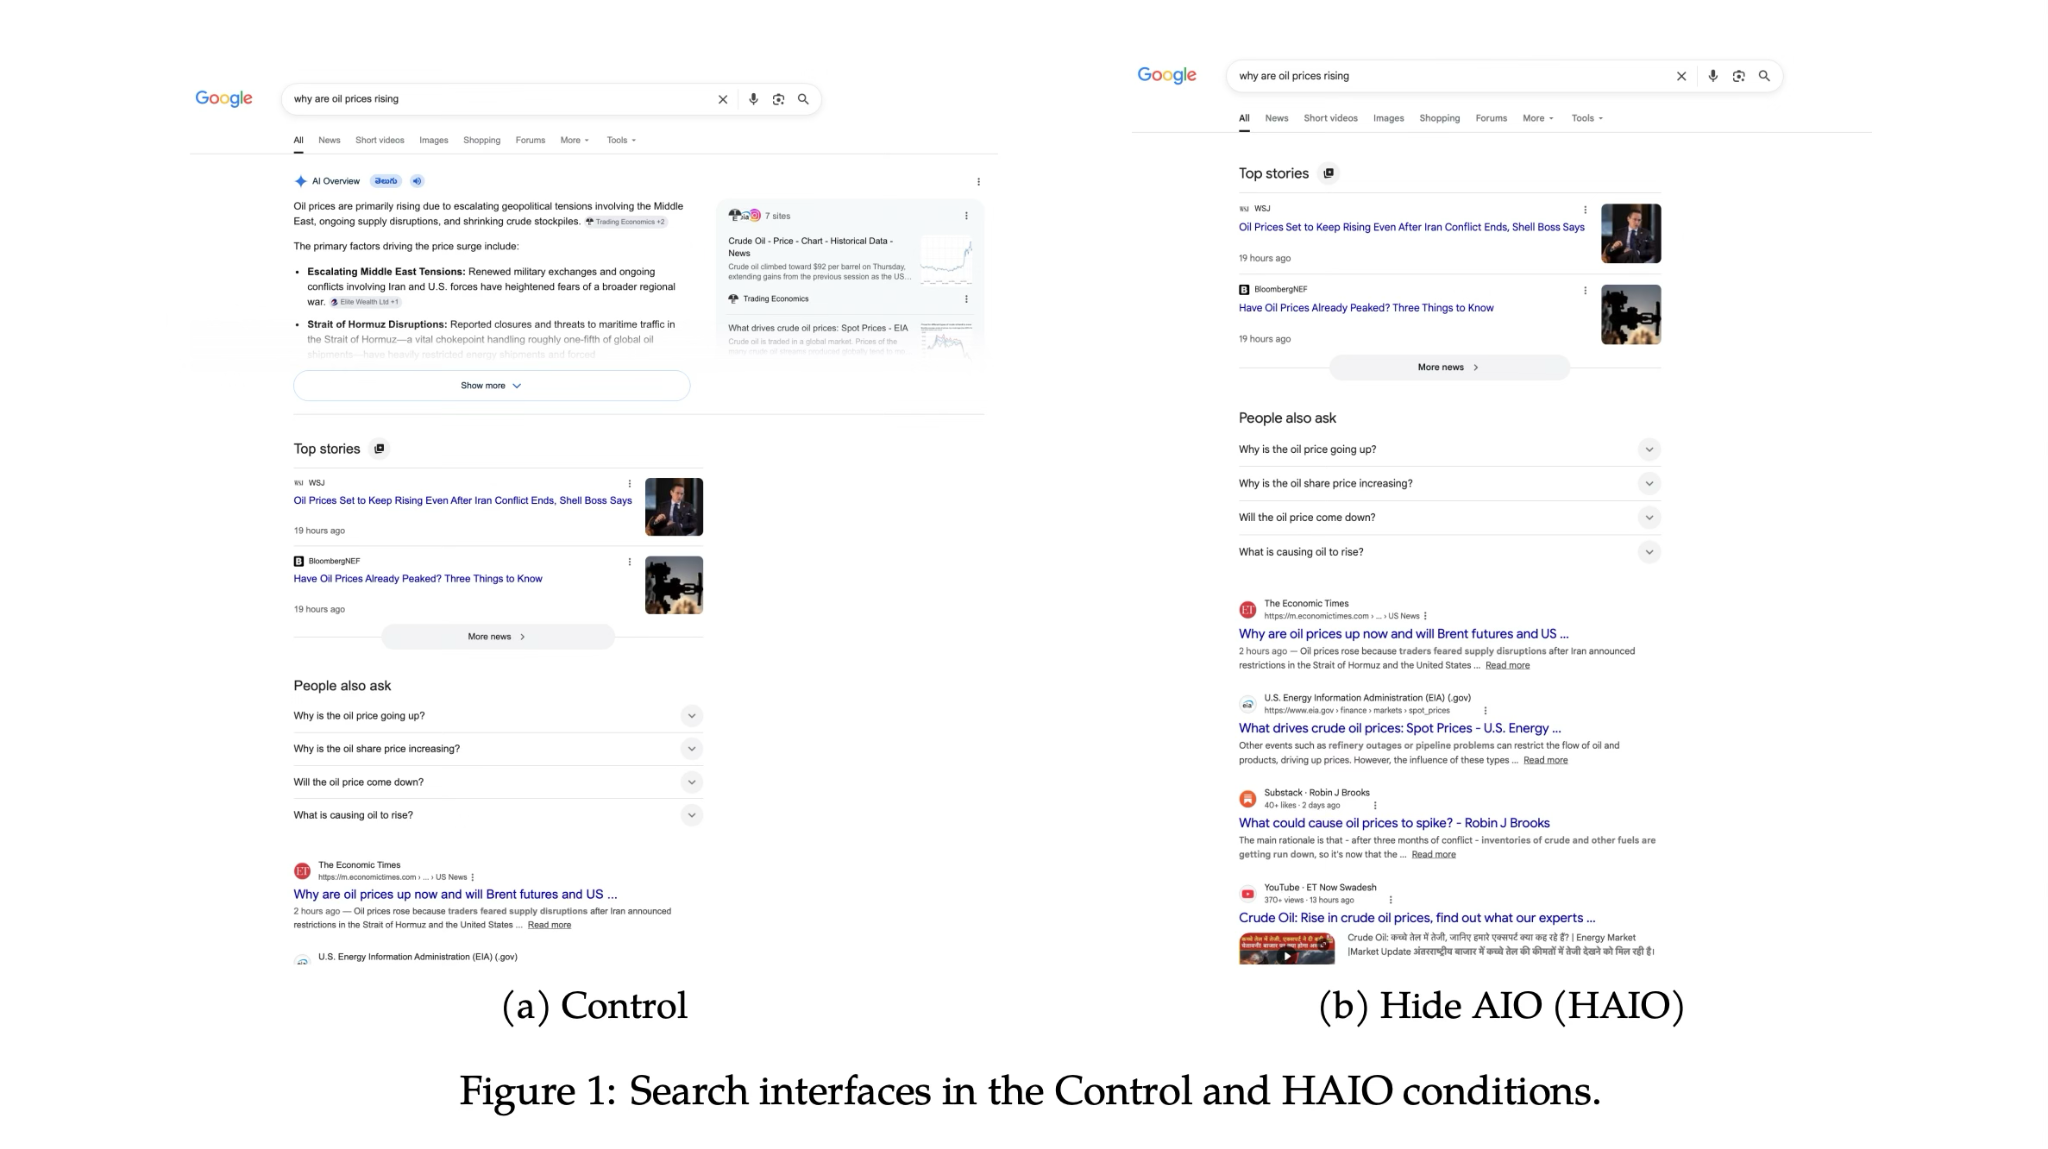
On the flip side, being cited inside an Overview partly cushions the blow. Seer found cited brands earn 35% more organic clicks and 91% more paid clicks than uncited ones on the same results page.
But we’re at a point where visibility and traffic have come apart. A page can appear in more Overviews while sending fewer people to the site, because the summary resolves the question in place.
Google’s own move to address this is telling in what it gave and what it withheld.
On June 3, 2026, Google launched dedicated Search Generative AI performance reports in Search Console, the first native view of how often your pages appear inside AI Overviews and AI Mode.
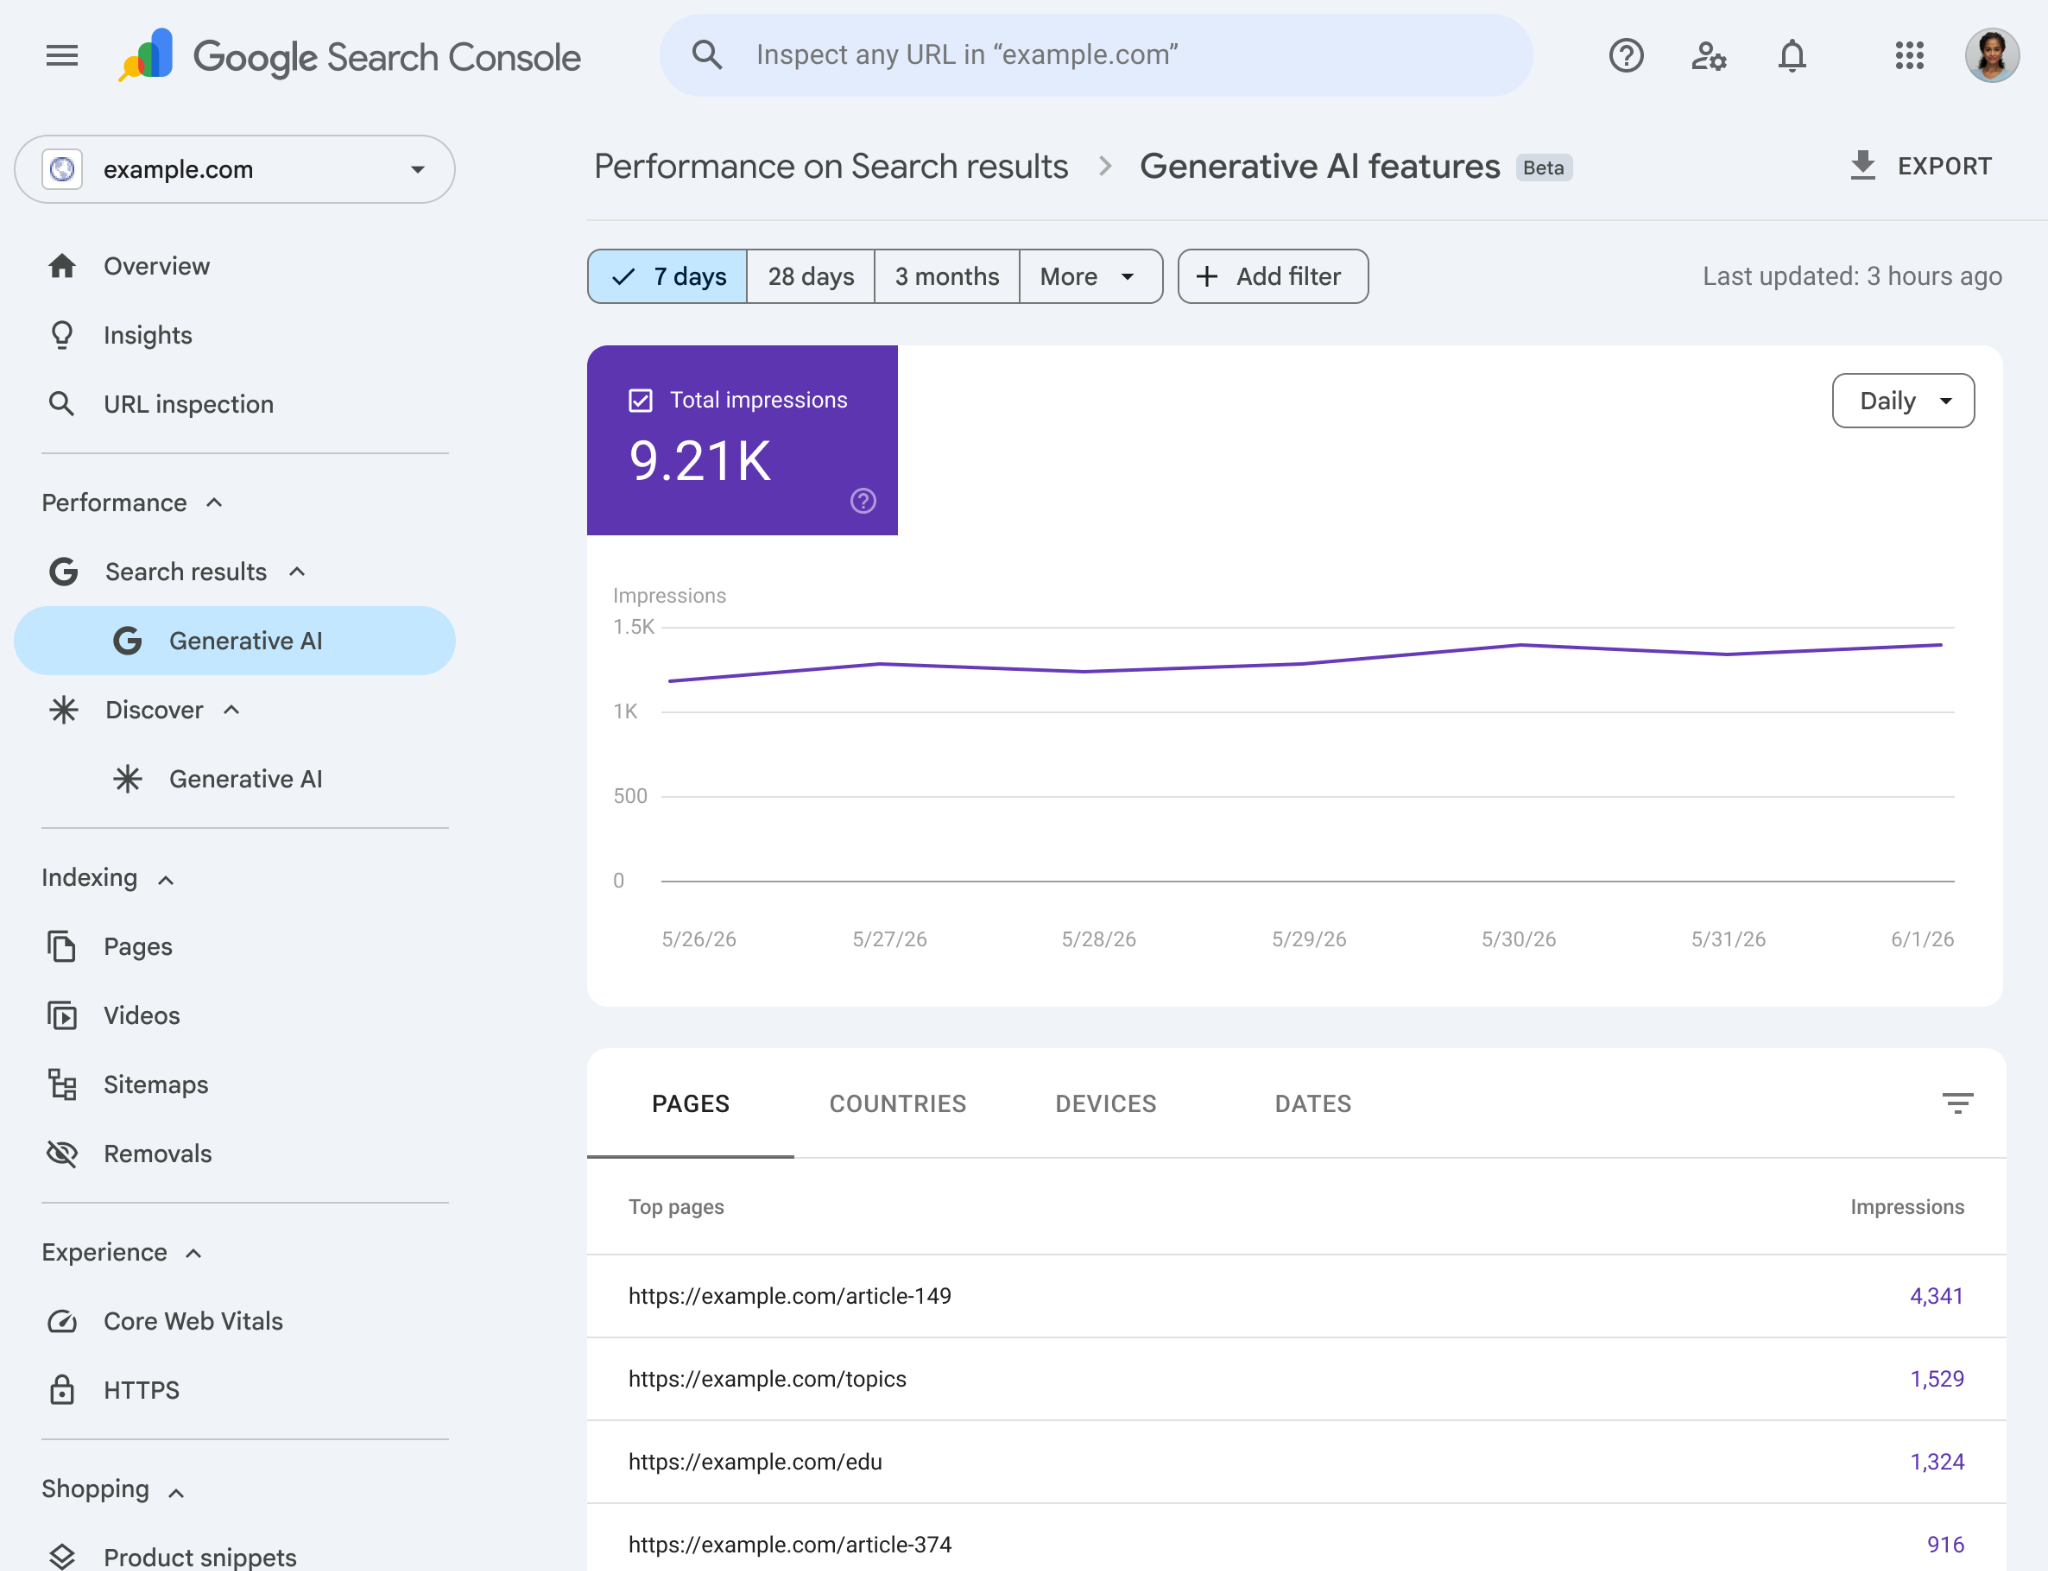
After two years of the industry flying blind, this is a real step. It is also a narrow one.
The reports show impressions only, broken out by page, country, and device, with data starting May 18, 2026 and no historical backfill.
There is no click data, click-through rate, average position, or even query-level breakdown, and the reports do not separate AI Overviews from AI Mode, which behave differently enough that lumping them together creates another problem.
Visibility Is Not Traffic, and Traffic Is Not Revenue
This is where the entire marketing leaders seem to be at loggerheads with their marketing departments, consultants, or agency of choice.
The metrics measure appearance BUT marketing leaders care about revenue.
And the current generation of tools we have cannot fully bridge this gap.
The first gap: visibility and traffic
Being in the answer does not mean being clicked, because the answer increasingly satisfies the user without a click.
When an AI generates an answer to a query, they often satisfy the searcher’s intent without a visit. So you can’t tie typical conversion metrics and traffic back to the citation or recommendation.
The second gap: traffic and revenue
There’s a ‘floating idea’ that AI-referred visitors convert far better than ordinary organic traffic. The stats from Semrush references a 4.4x advantage.
The logic is plausible, since a user who arrives after an AI recommended a brand has been pre-qualified in a way a blue-link clicker has not.
The evidence is thinner than the confidence, and every leader should hold these numbers as somewhat directional or baseline rather than what they’ve settled on.
What is solid is the structural claim. The metric that connects to pipeline is revenue attributed to AI-driven discovery. And almost no tool can measure it accurately, because the models mostly do not pass standard referrer data and much of the influence happens with no click at all.
What I’m driving at is that AI visibility measurement, as it exists in 2026, is a leading indicator two steps removed from the outcome that pays for it. That is not a reason to ignore it though.
Leading indicators are worth tracking. It is a reason to report it too, as a measure of presence in the discovery layer. But don’t dress it up as a revenue number it cannot yet be.
What Marketing Leaders Can Do About It
The situation looks bleak laid out this way (I’m not a doomsayer), and a fair amount of vendor content leans on that bleakness to sell certainty it cannot deliver.
The better response is a set of disciplines that make the measurement useful despite the noise. None of them require a particular tool. All of them survive the problems above.
Pick one methodology and hold it constant
Because API and UI scraping produce different numbers, and because tools calculate the underlying metric differently, comparing across tools is close to meaningless.
Choose the collection method that matches how your buyers actually interact with these systems, which for most consumer-facing decisions means UI scraping, and then stop comparing that tool’s output to anyone else’s.
Measure per engine and never blend
A single cross-engine score averages machines that retrieve, cite, and reward differently. Break the number apart by engine every time, and treat ChatGPT, Perplexity, Gemini, and Google’s AI surfaces as separate channels with separate strategies.
Move to weekly cadence on the queries that matter
Monthly measurement is defeated by 40 to 60% monthly citation drift before it starts. You do not need to track everything weekly, but the strategic query bank, the queries closest to a buying decision, deserves weekly reads so you can separate a real movement from ordinary churn.
Build a stable prompt bank and run it repeatedly
Because a single query run is one sample from a moving distribution, a real read comes from repetition, on the order of sixty to a hundred passes per prompt for a defensible single-point measurement.
Define the bank once, mix informational, comparison, and recommendation intent, and keep it fixed so that changes over time reflect the trend.
Triangulate visibility against outcomes you can see
The AI visibility number is a leading indicator. Pair it with the signals that sit closer to revenue. For example, GA4 sessions, the new Search Console AI impressions, branded search volume as a proxy for AI-driven awareness, and any lift in direct traffic that coincides with visibility gains.
No single one closes the gap between appearance and revenue, but together they give you something defensible.
Where This Goes Next: My Predictions
These are just personal opinions coming from months of research, industry report analysis, and general market sentiment.
Prediction 1: Dominant taxonomy
I think the definitional chaos will resolve toward a dominant taxonomy rather than a formal standard.
No standard body is going to ‘bless’ a single metric. What will happen, and is already happening, is that one vendor’s framework becomes the de facto reference the way Profound’s eight-category citation taxonomy is already treated as the most mature in the market.
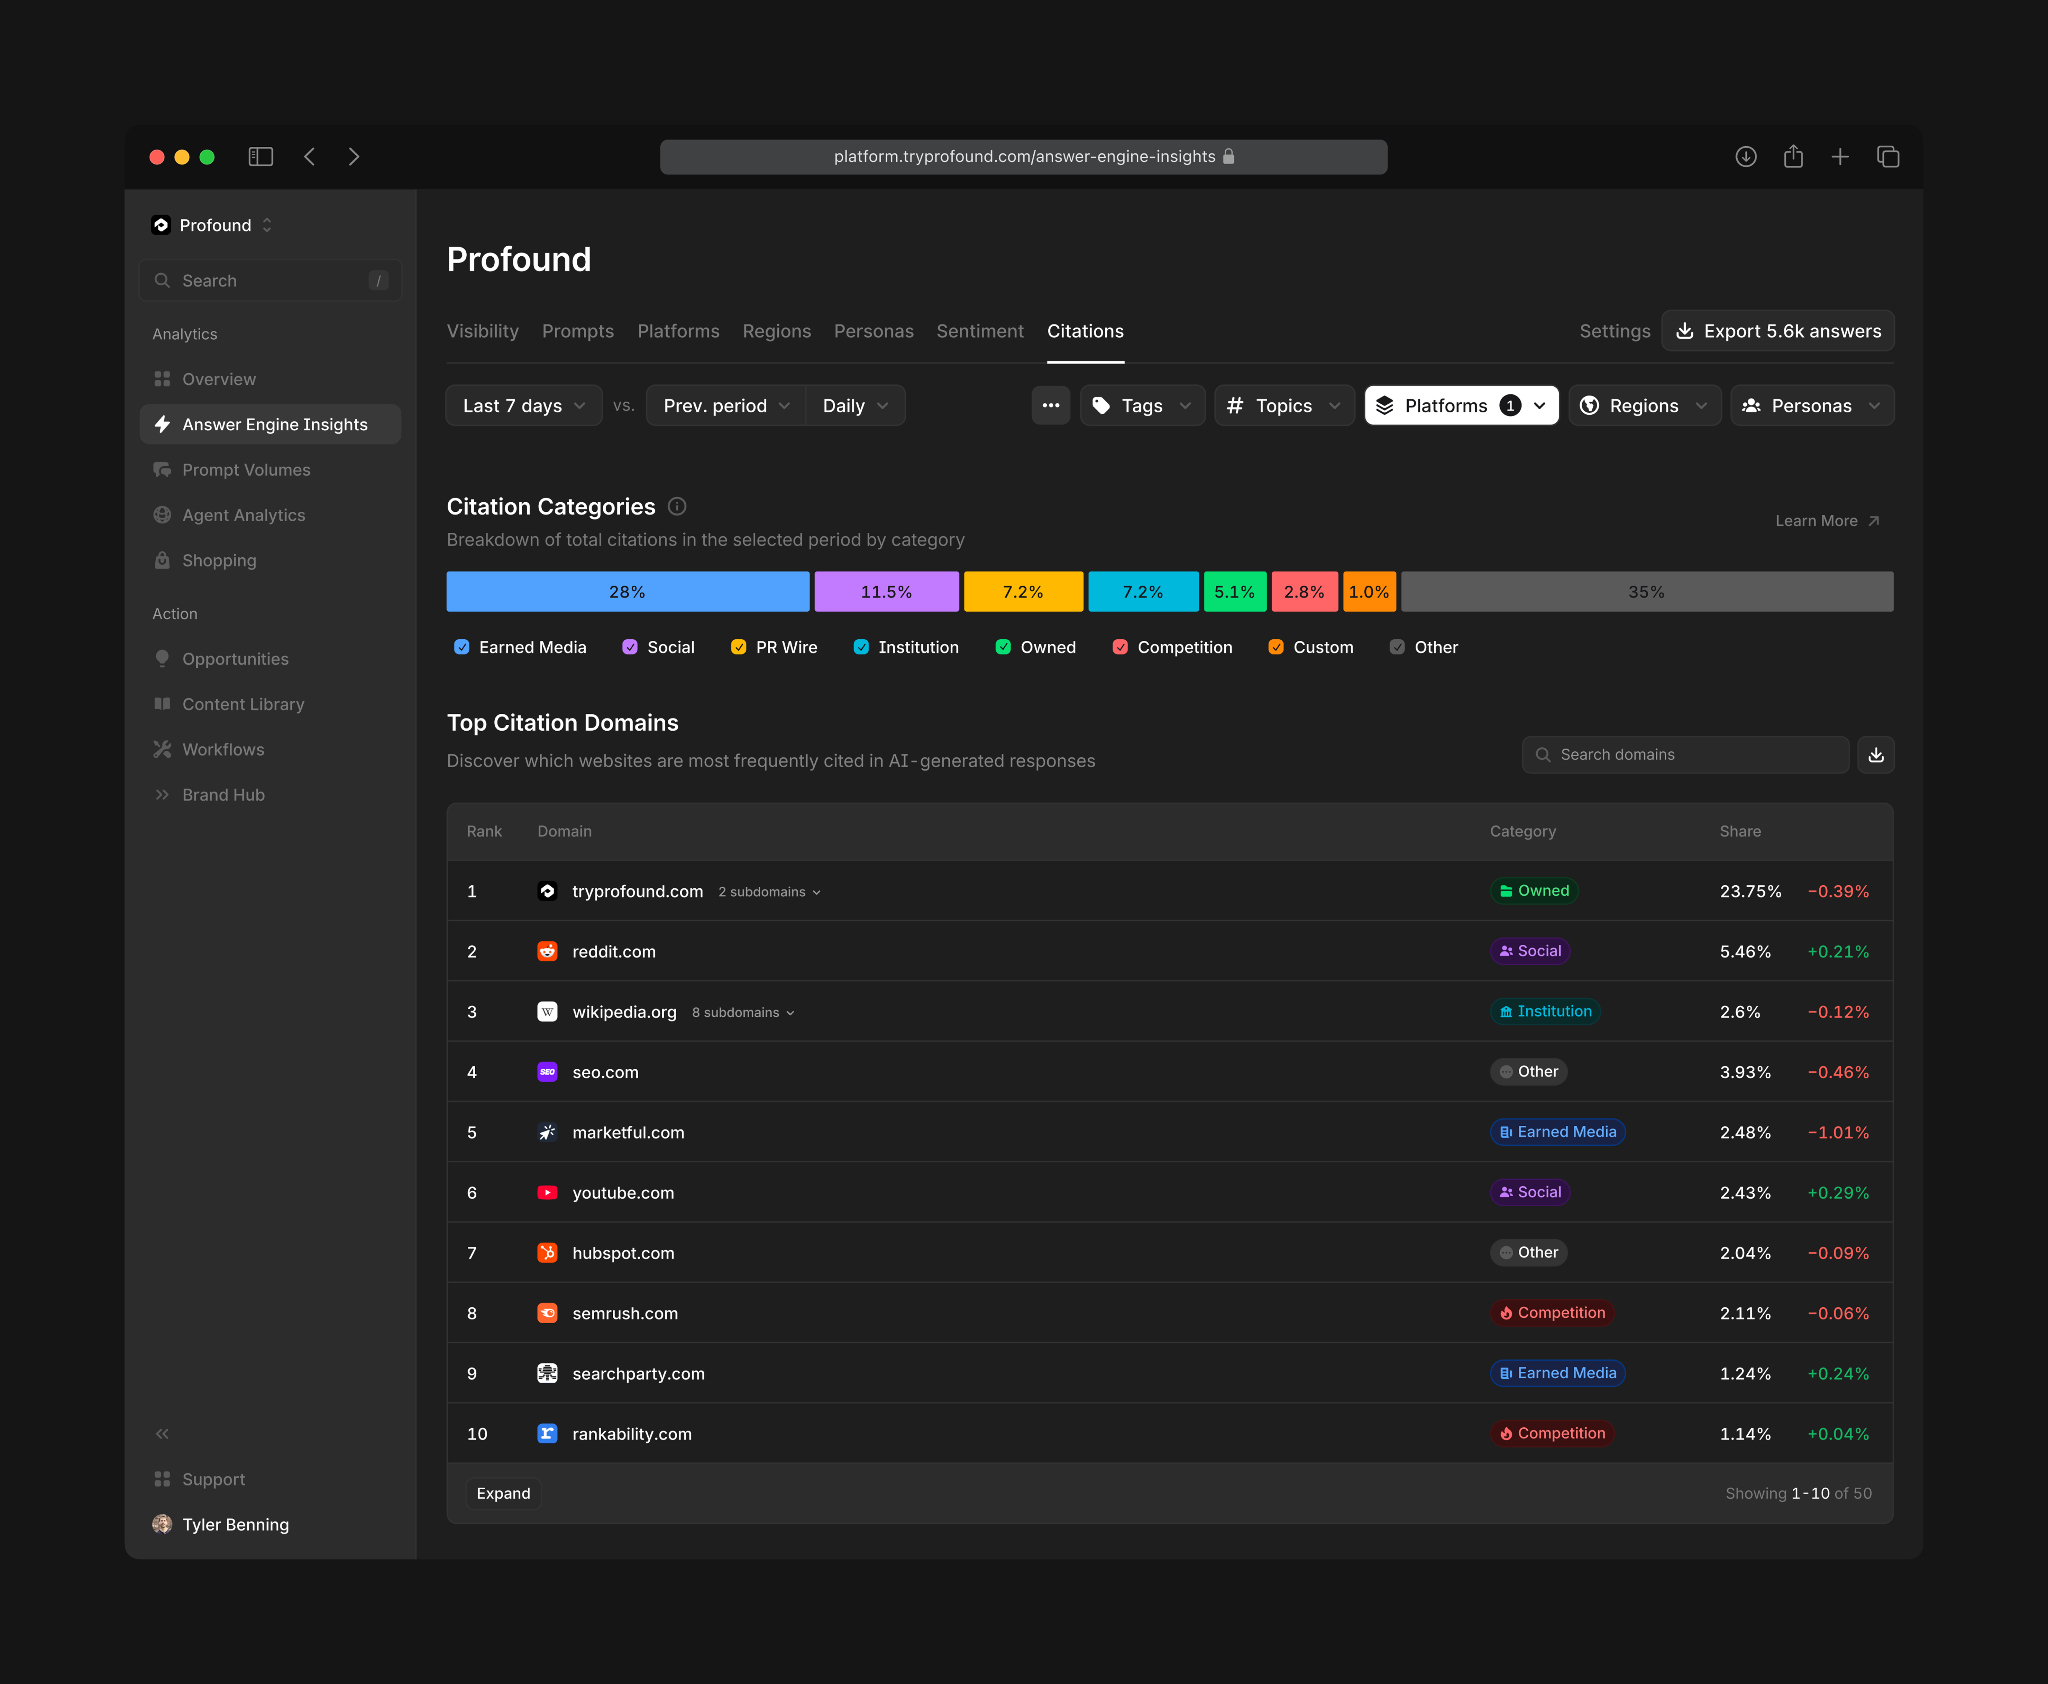
Expect the industry to converge on a small vocabulary, probably distinguishing mention from citation from recommendation, within the next year, driven by whichever players the largest brands standardize on.
Prediction 2: Google will come around
Google will eventually add clicks to its AI reports. . The June 2026 reports showed impressions and promised more metrics over time (I know we aren’t supposed to trust Google’s promises…but I’m optimistic *fingers crossed*).
The moment click data arrives, marketing leaders can finally compute the value of an AI appearance, and the measurement gap moves from half-closed toward closed. This will likely be within a year, and it’ll help move the conversation from visibility to value.
Prediction 3: The engines will not stabilize soon
SISTRIX found no leveling of drift across seventeen weeks. And the underlying cause, models continuously refreshing retrieval and reweighting sources, is not a bug the engines are motivated to fix.
Volatility is a feature of how these systems work. Measurement programs should be built to live with permanent churn rather than to wait it out.
Prediction 4: Precision becomes pointless
The tools that sell blended, cross-engine precision will lose credibility as buyers get more sophisticated. The market is already sorting toward vendors who disclose their methods per channel and away from those who advertise big prompt counts at suspiciously low prices.
As marketing leaders learn what questions to ask, the ‘precision theater’ (as Joachim calls it in his report) becomes a liability rather than a selling point.